Figure 4.
CRMP3 is involved in spinal cord injury.
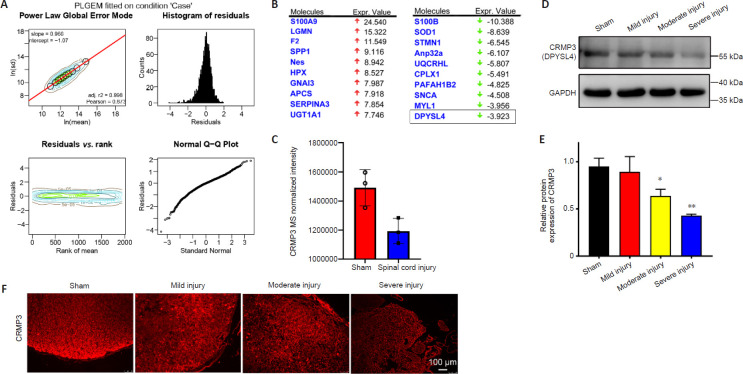
(A) PLGEM revealed equal goodness of fit for both sham and SCI datasets, with PLGEM modeling points shown in black on the corresponding contour plot. Red line corresponds to the PLGEM fitted to the indicated dataset. Residuals were calculated for each protein in a given dataset based upon the difference between the actual value and the PLGEM-predicted value and these residuals were plotted as a function of the rank of the row mean value and visualized using a contour plot. Distributions of residuals in the indicated contour plot are presented using a histogram to represent counts with equal-sized binning. Similarities between the distribution of residuals and the normal distribution are visualized with a quantile-quantile (Q-Q) plot. (B) The top 10 up- and down-regulated differentially expressed proteins from IPA analysis, identifying CRMP3 (DPYSL4) as a downregulated protein. (C) Relative expression of CRMP3 in LC-MS analysis of sham and SCI group samples. (D) CRMP3 (DPYSL4) was detected by western blotting of spinal cord from rats with SCI of different severities, with GAPDH used as a loading control (n = 3/group). (E) Quantification of CRMP3 protein expression levels by western blot analysis. Data are expressed as the mean ± SD (n = 3 rats in each group). *P < 0.05, **P < 0.01, vs. sham group (Student's t-test). (F) CRMP3 immunopositivity (red, Alexa Fluor 555) was detected via immunofluorescence staining, revealing that CRMP3 expression decreased as the degree of SCI increased. Scale bar: 100 μm. CRMP3: Collapsin response mediator protein; GAPDH: glyceraldehyde-3-phosphate dehydrogenase; IPA: ingenuity pathway analysis; LC-MS: liquid chromatography-mass spectrometry; PLGEM: power law global error model.

