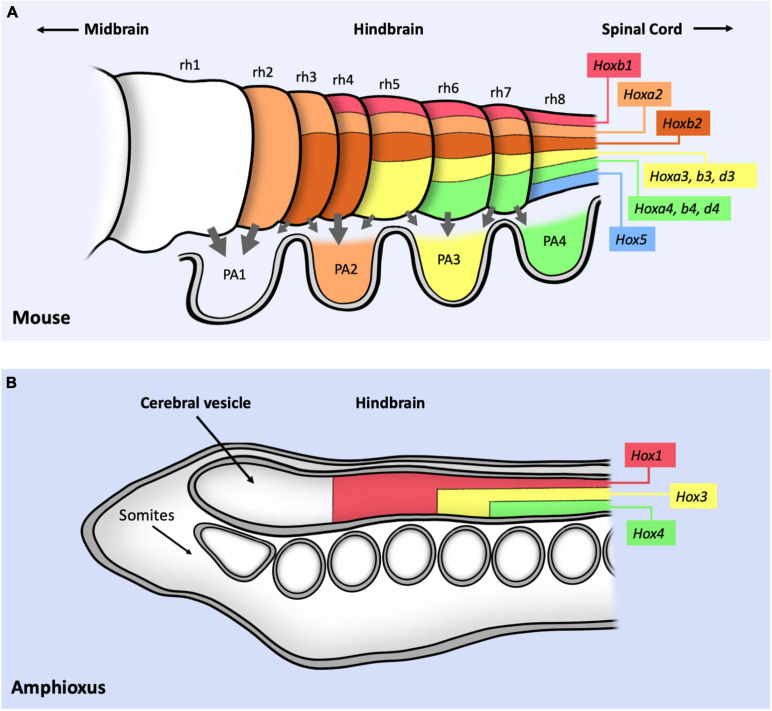
FIGURE 3.
Schematic representation of Hox expression in the cephalic mouse and Amphioxus central nervous systems. (A) Summary of Hox1–5 expression in the hindbrain, labeling the position of the eight different rhombomeres (rh1–8). Gray arrows represent the migratory movement of the cranial neural crest cells toward the pharyngeal arches (PA1–4). PA are colored following the pharyngeal Hox code: no Hox proteins are expressed in PA1; HoxA2 and B2 proteins are expressed from PA2 to PA4; HoxA3, B3 and D3 from PA3 to PA4; HoxA4, B4, D4 and Hox5 in PA4. (B) Expression of three Hox genes in the anterior part of the Amphioxus CNS. Note that the conserved relative position of Hox gene expression with respect to the mouse CNS suggest a positional correlation of both nervous systems despite the lack of rhombomeres or neural crest cells in Amphioxus. In both panels, information only concerns antero-posterior expression and not dorso-ventral expression. Figure based on data from references (Holland et al., 2008; Philippidou and Dasen, 2013; Parker et al., 2018).

