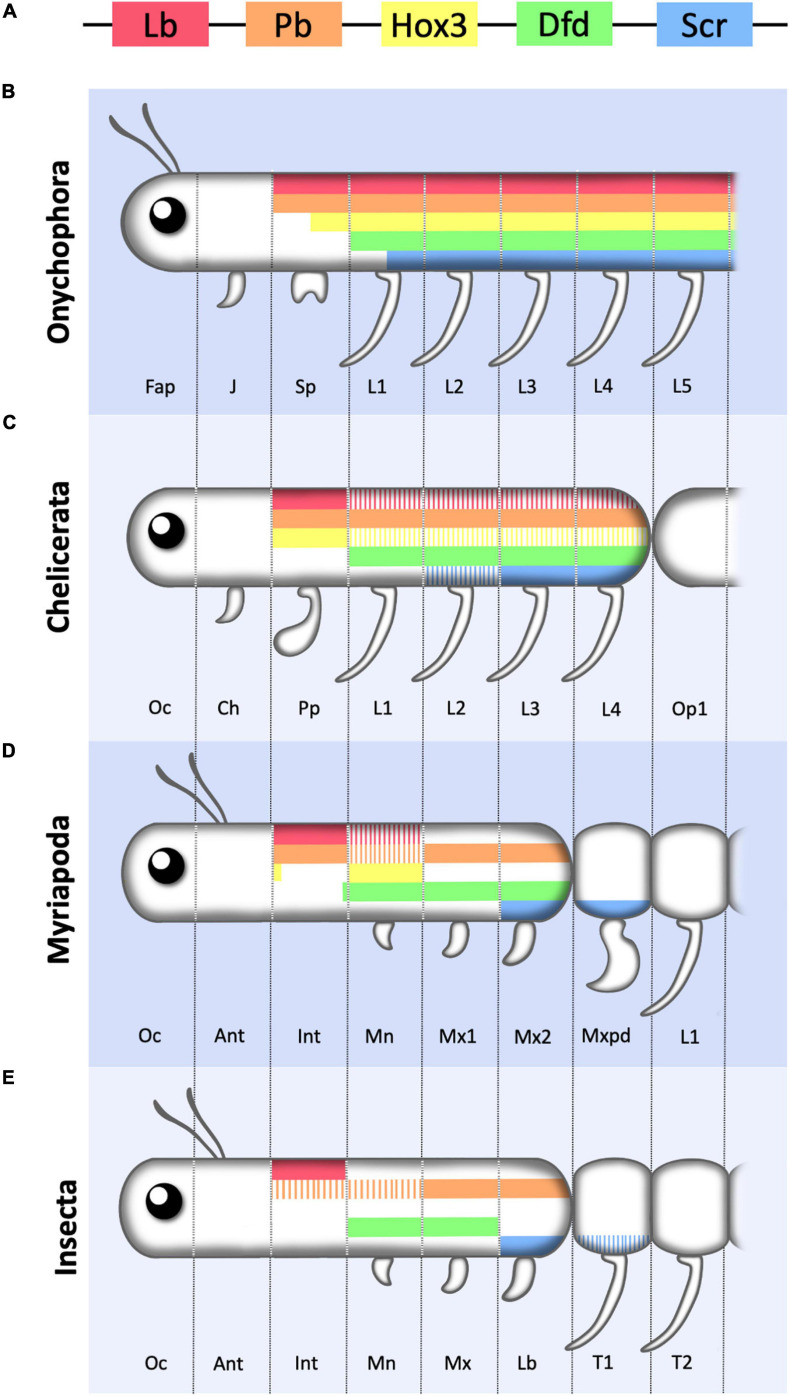
FIGURE 4.
Schematic representation of Hox1–5 expression in the anterior region of the Onychophora and various arthropods. (A) Color key of the five Hox genes considered in this review represented following the relative positions they occupy in the cluster. (B) Onychophora showing the three head segments (Fap, frontal appendage; J, jaw; Sp, slime papilla) and the first five leg (L) bearing segments. (C) Chelicerate showing the first three cephalic segments (Oc, ocular; Ch, chelicerae; Pp, pedipalp) and the four legged prosomal segments. (D) Myriapod showing the six cephalic segments (Oc, ocular; Ant, antennal; Int, intercalary; Mn, Mandibula; Mx1, first maxilla; Mx2, second maxilla) followed by the trunk leg (L) bearing segments of which the most anterior one forms a maxilliped (Mxpd). (E) Insect showing the six cephalic segments (Oc, ocular; Ant, antennal; Int, intercalary; Mn, Mandibula; Mx, maxilla; Lb, Labium) followed by two of the three thoracic leg (L) bearing segments. Hox3 has not been represented as in most insects it has lost its Hox function. Note that the most anterior cephalic segments lack Hox expression, and that anterior Hox genes required for the formation of cephalic structures in insects may be expressed in leg bearing segments in other phyla, indicating that there is no strict correlation between cephalization vs. trunk development and Hox1–5 expression. For simplicity Crustaceans are not included in the figure and coloring represents antero-posterior Hox expression only. Solid bars represent main or stronger expression compared to striped bars. Figure based on data from references (Hughes and Kaufman, 2002b; Janssen et al., 2014).

