
Figure 7.
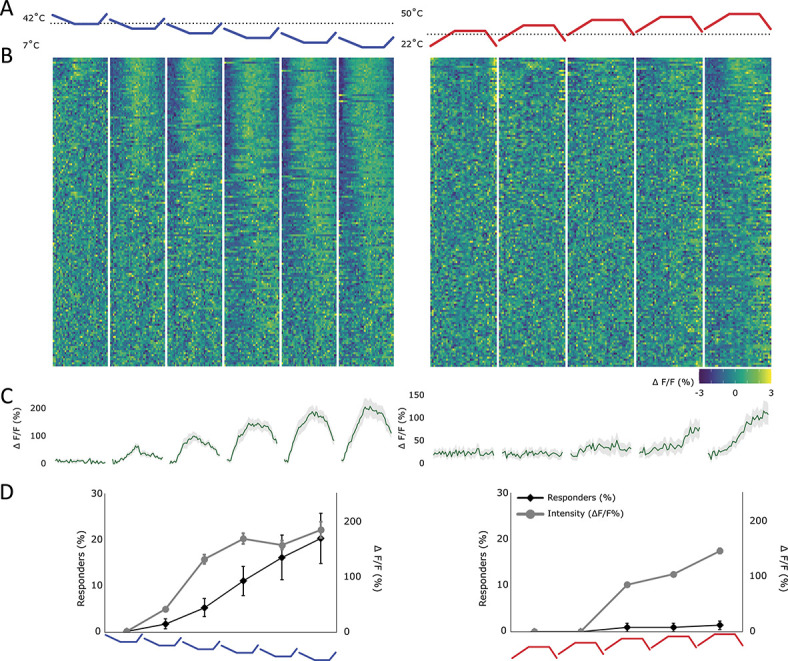
Response of lamina I projection neurons to ramps with variable end temperatures. This figure used “baseline variable heating/cooling ramps,” cf Materials and Methods. (A) Profile of the cold (blue) and hot (red) stimulus applied to the ipsilateral paw. The end temperatures were varied (for cold: 7-32°C and for heat: 35-50°C), but the amount of change remained stable (for cold: 10°C and for hot: 13°C). Black dotted line represents the normal skin temperature (32°C). (B) Heat map of the response of all recorded lamina I projection neurons, sorted by strength of correlation with the respective thermal ramp profile (in absolute measures). Each cell's fluorescence is normalised (mean subtracted and divided by SD). Left: neurons responding to the above depicted cold ramps and right: neurons responding to the above depicted hot ramps. (C) Average profile of cells showing any response to either a cold (left) or a hot (right) stimulus. Gray shaded area ± SEM. (D) Percentage of cells responding (diamond shapes, black line, left y-axis) and the average intensity of the response (circles, gray line, right y-axis) to each ramp individually. Mean ± SEM. N = 7 animals and n = 152 cells.