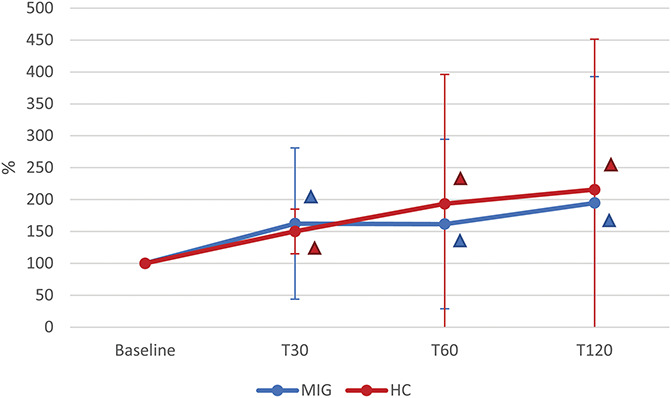
Figure 2.

Time course of plasma AEA levels after NTG administration in MIG and HC groups. T30, T60, and T120: evaluations at 30, 60, and 120 minutes after nitroglycerin (NTG) administration (0.9 mg sublingual). MIG: subjects with episodic migraine (n = 24); HC: healthy controls (n = 19). Statistical analysis: 2-factor ANOVA for repeated measures (factor “GROUP” with 2 levels: MIG vs HC; factor “TIME” with 4 levels: Baseline, T30, T60, T120). TIME: P = 0.022; GROUP: P = 0.779; TIME × GROUP: P = 0.671. Δ = post hoc analysis: P < 0.050 vs Baseline (the color identifies the group). AEA, anandamide; ANOVA, analysis of variance.
