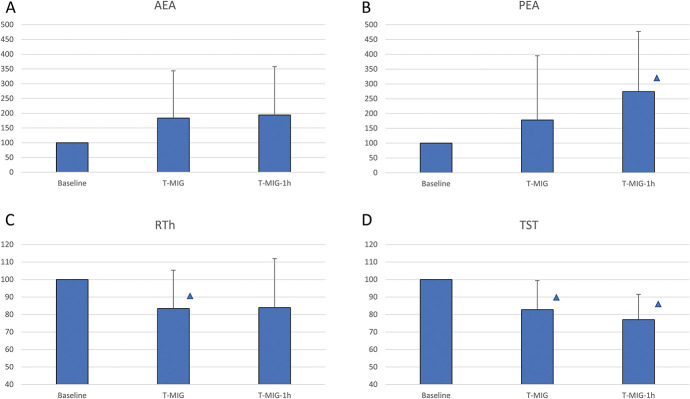
Figure 8.
Changes in endocannabinoid levels and neurophysiological parameters recorded at migraine onset and 1 hour later in migraine subjects showing a positive response to the migraine-induction test within the 180-minute in-hospital observation period. Data from migraine subjects showing a positive migraine-induction test response within the 180-minute in-hospital observation period (MIG+ subgroup, n = 13). T-MIG: evaluation at migraine onset; T-MIG-1h: evaluation 1 hour after migraine onset. Statistical analysis: 1-factor ANOVA for repeated measures (factor “TIME” with 3 levels: Baseline, T-MIG, T-MIG-1h): AEA (A): TIME: P = 0.184. PEA (B): TIME: P = 0.035. RTh (C): TIME: P = 0.035. TST (D): TIME: P = 0.001. Δ = post hoc analysis: P < 0.050 vs Baseline. AEA, anandamide; ANOVA, analysis of variance; PEA, palmitoylethanolamide; RTh, reflex threshold.

