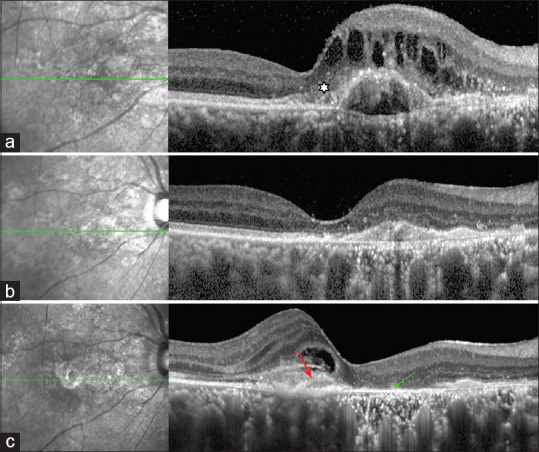
Figure 2.

(a) Baseline SD-OCT image showing SHRM (white asterisk) above RPE with fibrovascular pigment epithelial detachment (FVPED). (b) SD-OCT image showing complete resolution of IRF with collapse of FVPED at 6- follow-up. (c) SD-OCT image at 12 months showing GA at the site of SHRM (green arrow) and scar formation temporal to macula (red arrow)
