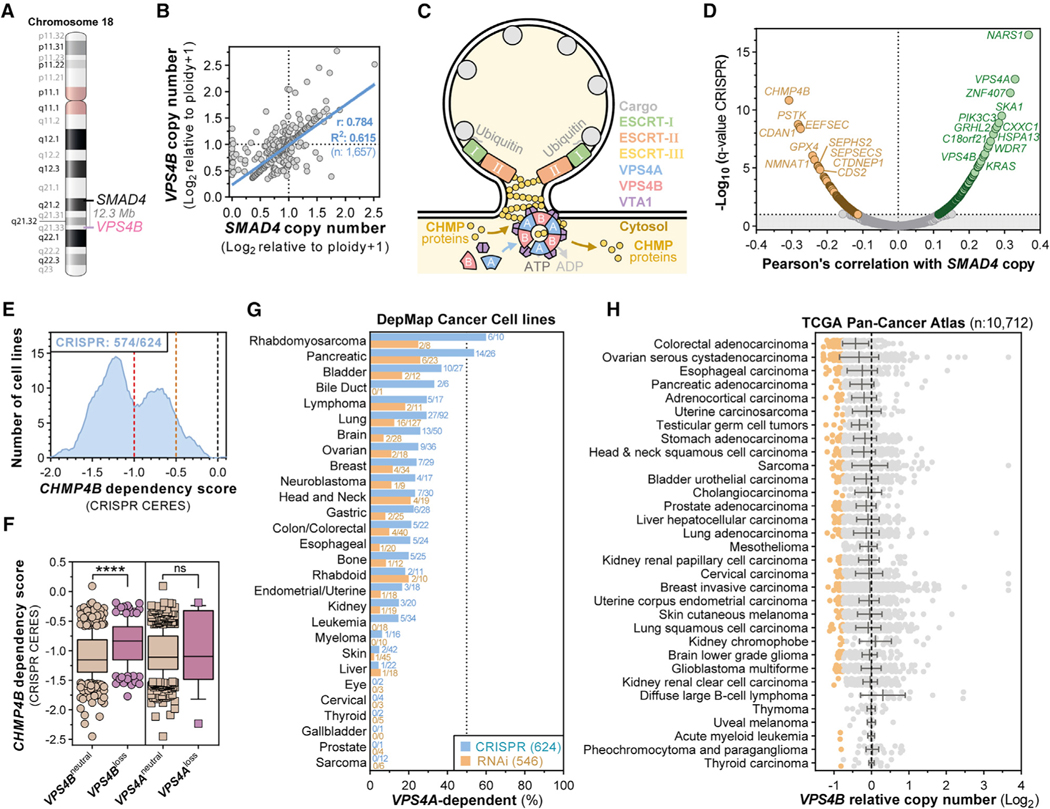
Figure 2. The ESCRT Enzymes VPS4A and VPS4B Are Paralog Synthetic Lethal Vulnerabilities in Cancers Harboring SMAD4 or CDH1 Loss.
(A) Genomic location of SMAD4 and VPS4B on human chromosome 18.
(B) Scatterplot showing SMAD4 (x axis) and VPS4B (y axis) log2-normalized relative copy numbers in 1,657 cancer cell lines and linear regression with 95% confidence interval (blue line) and Pearson’s coefficient.
(C) Illustration of ESCRT- and VPS4-mediated reverse topology membrane remodeling.
(D) Volcano plot of Pearson’s correlation coefficients between CRISPR-SpCas9 gene dependency scores and SMAD4 copy number (x axis) and the log10-normalized q-value for each of these correlations (y axis) across 622 cancer cell lines from the Dependency Map (19Q3). Significant dependencies are colored. Horizontal line: 10% FDR (q < 0.1).
(E) Smoothed histogram showing the distribution of CHMP4B dependency scores from the CRISPR-SpCas9 Dependency Map dataset (19Q3) across cancer cell lines. The number of dependent cell lines (CRISPR score less than —0.5, orange line) over the total number of probed cell lines is shown in the top left corner. Red line at —1: CRISPR score for a set of highly essential genes. Black line at 0: CRISPR score of negative control sgRNAs.
(F) Boxplot of CRISPR-SpCas9 CHMP4B gene dependency scores across cancer cell lines with neutral or reduced VPS4B or VPS4A copy number (Log2 relative copy number < 0.66) in the Dependency Map. ns, not significant; ****p < 0.0001.
(G) Frequency of VPS4A-dependent cancer cell lines by tumor lineage in the Dependency Map 19Q3 dataset.
(H) Summary of VPS4B copy number alterations in TCGA Pan-Cancer Atlas patient samples categorized by tumor type. Orange dots denote patient samples with strong VPS4B loss (less than −0.75).
See also Figures S2–S4 and Table S1.

