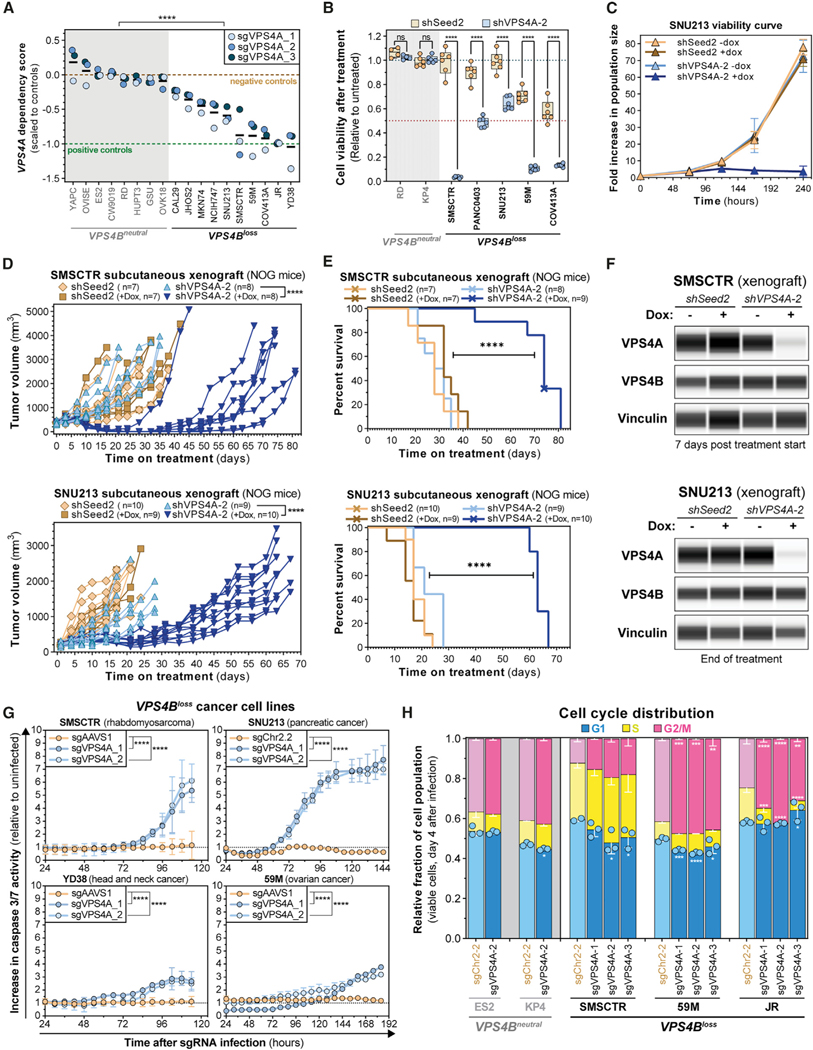
Figure 3. Validation of VPS4A as a Dependency in Cancer Cells with Copy Loss of VPS4B.
(A) Seven-day viability assays from eight VPS4Bneutral and 10 VPS4Bloss cell lines stably transduced with CRISPR-SpCas9. Each dot represents the mean viability effect (y axis) of cells infected with the indicated sgRNA (n = 3). Black bars indicate the mean cell viability effect of all three VPS4A sgRNAs. See Method Details. ****p < 0.0001.
(B) Seven-day viability assays from 2 VPS4Bneutral and 5 VPS4Bloss cell lines stably transduced with the shSeed2 control (orange) and shVPS4A-2 (blue) tetracycline-inducible RNAi reagents after treatment with 0.5 μM of doxycycline (dox; 0.222 μg/mL). Each dot represents a technical replicate and shows relative cell viability (y axis) compared with untreated cells. ns, not significant; ****p < 0.0001.
(C) Ten-day proliferation curve of VPS4Bloss SNU213 pancreatic cancer cells stably transduced with the tetracycline-inducible RNAi system for shSeed2 control (orange and brown) or shVPS4A-2 (blue). Cells were either grown in control or 1 mM dox (0.444 μg/mL) medium.
(D) In vivo subcutaneous tumor growth in immune-compromised NOG mice of VPS4Bloss SMSCTR rhabdomyosarcoma (top) and SNU213 pancreatic cancer cells (bottom) stably transduced with the SpCas9 endonuclease and either the shSeed2 control (orange) or the shVPS4A-2 (blue) tetracycline-inducible RNAi systems. ****p < 0.0001.
(E) Kaplan-Meier survival plot of NOG mice bearing subcutaneous SMSCTR (top) or SNU213 (bottom) xenografts described in (D). Crosses indicate censored mice. ****p < 0.0001.
(F) Digitized immunoblot for VPS4A, VPS4B, and Vinculin from SMSCTR (top) and SNU213 (bottom) xenograft tumors in NOG mice described in (D). SMSCTR, 7 days after randomization; SNU213, days 20~25 after treatment start for shSeed2 untreated or day 73 after treatment start for shVPS4A-2, +dox.
(G) Caspase 3/7 apoptosis activity (y axis) over time (x axis) in four cancer cell lines. Cells stably expressing SpCas9 were lentivirally transduced with a control sgRNA (orange) or an sgRNA targeting VPS4A (blue). Caspase 3/7 signal was normalized relative to time-matched uninfected cells. ****p < 0.0001.
(H) Stacked bar plots showing cell cycle distribution of ES2, KP4 (VPS4Bneutral, gray) and SMSCTR, 59M and JR (VPS4Bloss, black) cells using DAPI staining and EdU incorporation analyzed by flow cytometry 4 days after VPS4A ablation by CRISPR-SpCas9. *q < 0.05, **q < 0.01, ***q < 0.001, ****q < 0.0001.

