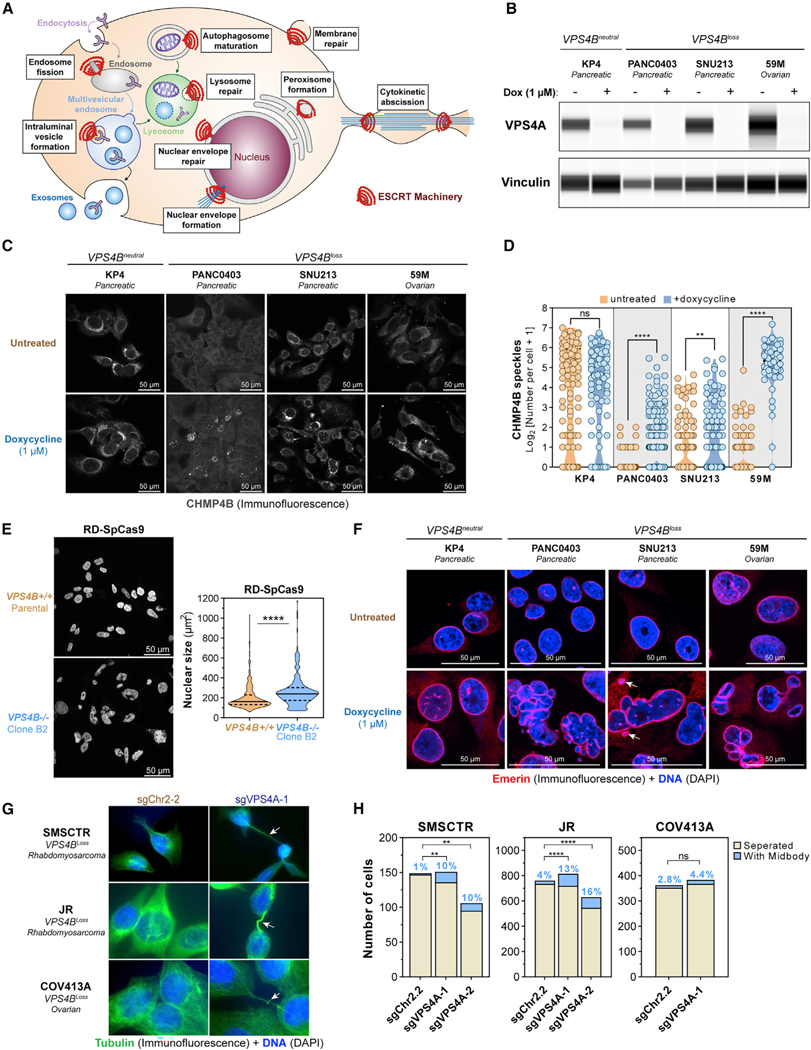
Figure 5. VPS4A Suppression Leads to ESCRT-III Filament Accumulation, Deformed Nuclei, and Abscission Defects in VPS4Bloss Cancer Cells.
(A) Known functions of the ESCRT machinery in membrane biology.
(B) Digitized immunoblot showing VPS4A and Vinculin protein levels in VPS4Bneutral and VPS4Bloss cancer cell lines with the dox-inducible shVPS4A-2 RNAi system after 5 days of treatment with control or 1 μM dox.
(C) Confocal immunofluorescence of CHMP4B in four cancer cell lines with the dox-inducible shVPS4A-2 RNAi system, from (B) imaged after 6 days of treatment. (grayscale, scale bars: 50 μm).
(D) Quantification of CHMP4B speckle formation in untreated (orange) and dox-treated (blue) cells from (C) on multiple random images (n = 3–9). ns, not significant; **q < 0.01, ****q < 0.0001.
(E) Confocal fluorescence imaging of DNA (DAPI, blue) of parental RD-SpCas9 cancer cells euploid for VPS4B copy and clone B2 RD-SpCas9 cancer cells with knockout of VPS4B (Figures 4F, 4G, and S6D). Scale bars: 50 mm. Nuclear surface size by CellProfiler. ****p < 0.0001.
(F) Confocal (immuno)fluorescence of the inner nuclear membrane protein Emerin (Alexa Fluor 561, red) and DNA (DAPI, blue) in four different cancer cell lines, from (B) after 6 days of treatment. Arrows: micronuclei. Scale bars: 50 μm.
(G) (Immuno)fluorescence of cytokinetic bridges and midbodies using tubulin (Alexa Fluor 488, green) and DNA (DAPI) in 3 different cancer cell lines after 4 days of induction of CRISPR-SpCas9-mediated disruption of an intergenic region (sgChr2–2) or VPS4A (sgVPS4A-1). Arrows: cytokinetic bridges.
(H) Quantification of cancer cells connected to neighboring cells by cytokinetic bridges. ns, not significant; **p < 0.01, ****p < 0.0001.
See also Figure S7.

