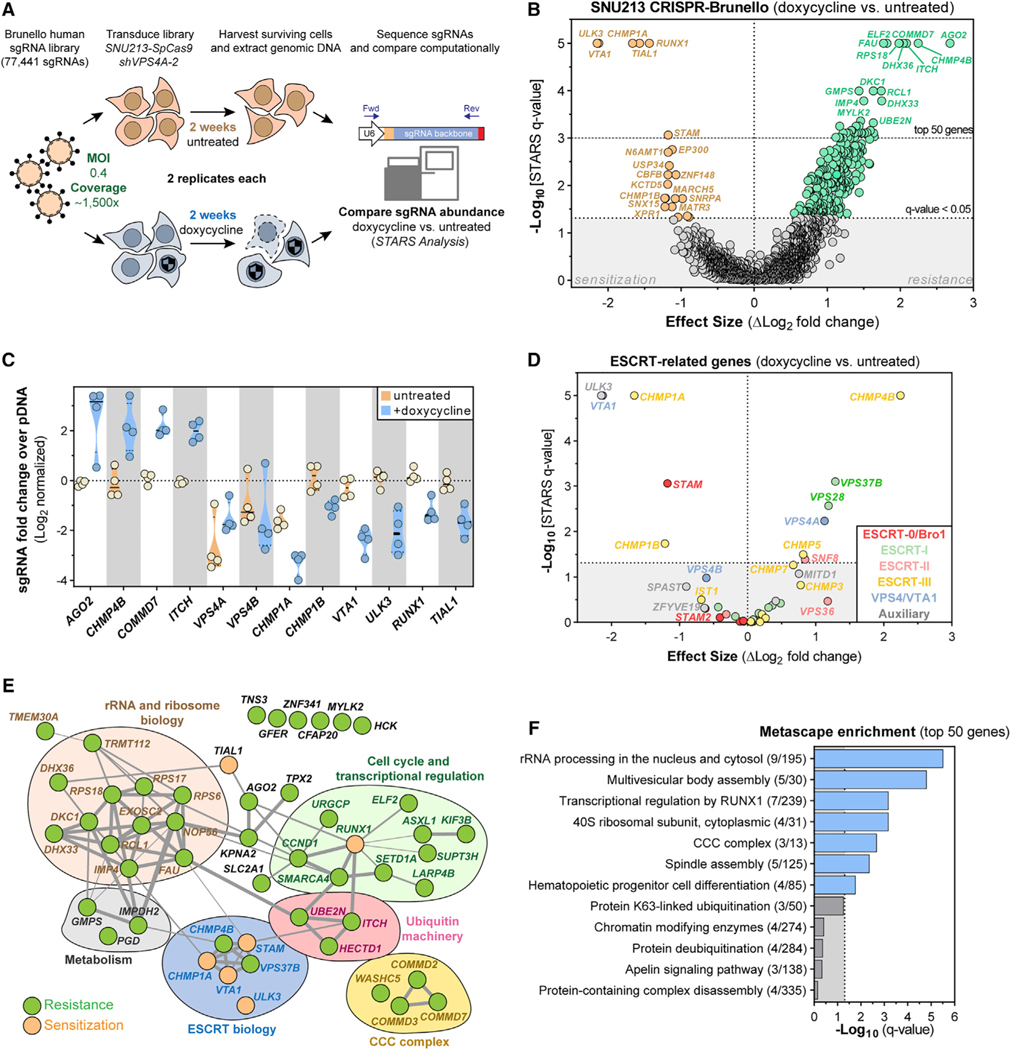
Figure 6. CRISPR-SpCas9 Screening Reveals That ESCRT Proteins and the ULK3 Kinase Modify Sensitivity to VPS4A Suppression.
(A) CRISPR-SpCas9 loss-of-function screen in SNU213-SpCas9 pancreatic cancer cells to identify modifiers of VPS4A dependency.
(B) Volcano plot highlighting genes for which knockout altered cell viability of VPS4A-suppressed SNU213-SpCas9 cells. Each dot represents a gene. Difference in log2-normalized mean sgRNA abundance between untreated and dox-treated (VPS4A suppressed) cells (x axis) and the significance of the q-value of this difference (y axis) are shown. Significant genes that sensitized cells to VPS4A suppression are orange; genes promoting resistance to VPS4A suppression are green.
(C) Log2-normalized mean fold changes for individual sgRNA abundance (colored circles) in SNU213 cells for genes scoring as top hits in the differential analysis
(B) of untreated (orange) and dox-treated (blue) samples.
(D) Volcano plot, similar to (B), showing only genes related to the ESCRT machinery.
(E) Manually annotated protein network of the top 50 scoring genes causing sensitivity or resistance to VPS4A suppression from the screen (B). Grey connections indicate strength of interaction between proteins as predicted by STRING (https://string-db.org)
(F) Gene set-enrichment plot of statistical significance (x axis) of Metascape (https://metascape.org) summary gene sets mapping to the top 50 scoring genes from the screen.

