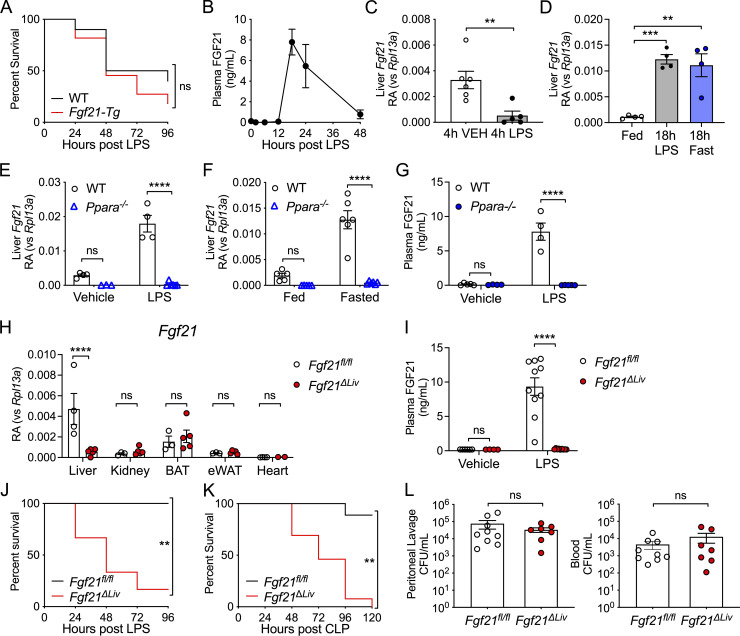
Figure 1.
Increased circulating FGF21 during bacterial inflammation is hepatic in origin and required for survival. (A) Kaplan–Meier survival curve after 12.5 mg/kg i.p. LPS for WT and Fgf21-Tg mice. n = 10–11/group; pooled data from two independent experiments. (B) WT mice were challenged with 12.5 mg/kg i.p. LPS. Plasma FGF21 levels were measured by ELISA, n = 4–5/time point. Data are from one of two independent experiments with similar results. (C) Relative abundance (RA) of mRNA expression in whole-liver tissue 4 h after PBS vehicle (VEH) or 12.5. mg/kg i.p. LPS challenge in WT mice, shown relative to Rpl13a. n = 5–6/group; pooled data are from two of four independent experiments with similar results. (D) mRNA expression in whole-liver tissue, shown relative to Rpl13a, 18 h after PBS vehicle (Fed), 15 mg/kg i.p. LPS, or fasting in WT mice, n = 4/group; data are from one of six independent experiments with similar results. (E) mRNA expression of whole-liver tissue, shown relative to Rpl13a, 20 h after PBS vehicle or 15 mg/kg i.p. LPS in WT and Ppara−/− mice. n = 3–7/group; data are from one of three independent experiments with similar results. (F) mRNA expression of whole-liver tissue, shown relative to Rpl13a, from ad libitum–fed or 24 h fasted WT and Ppara−/− mice. n = 5–6/group; data are from one of three independent experiments with similar results. (G) Plasma FGF21 levels by ELISA 18 h after PBS vehicle or 15 mg/kg i.p. LPS in WT and Ppara−/− mice. n = 4–5/group; data are from one of two independent experiments. (H) mRNA expression in whole tissue from Fgf21fl/fl and Fgf21ΔLiv mice, shown relative to Rpl13a. n = 3–5/group; data are from one of two independent experiments. BAT, brown adipose tissue; eWAT, epididymal white adipose tissue. (I) Plasma FGF21 levels measured by ELISA 20 h after 5 mg/kg i.p. LPS or PBS vehicle in Fgf21fl/fl and Fgf21ΔLiv mice. Vehicle n = 4–6/group; LPS n = 8–12/group; pooled data are from three independent experiments. (J) Kaplan–Meier survival curve after 10 mg/kg i.p. LPS for Fgf21fl/fl and Fgf21ΔLiv mice. n = 5–6/group; data are from one of three independent experiments with similar results. (K) Kaplan–Meier survival curve after CLP for Fgf21fl/fl and Fgf21ΔLiv mice. n = 9–13/group; pooled data are from two independent experiments. (L) CFUs cultured from mouse peritoneal lavage fluid and blood 24 h after CLP, n = 7–9/group; pooled data are from two independent experiments. **, P < 0.01; ***, P < 0.001; ****, P < 0.000, log-rank (Mantel–Cox) test (A, J, and K); two-sided, unpaired t test (C and L); one-way ANOVA with Dunnett's multiple comparisons test (D); two-way ANOVA with Sidak’s multiple comparisons test (E–I). Data are expressed as mean ± SEM.

