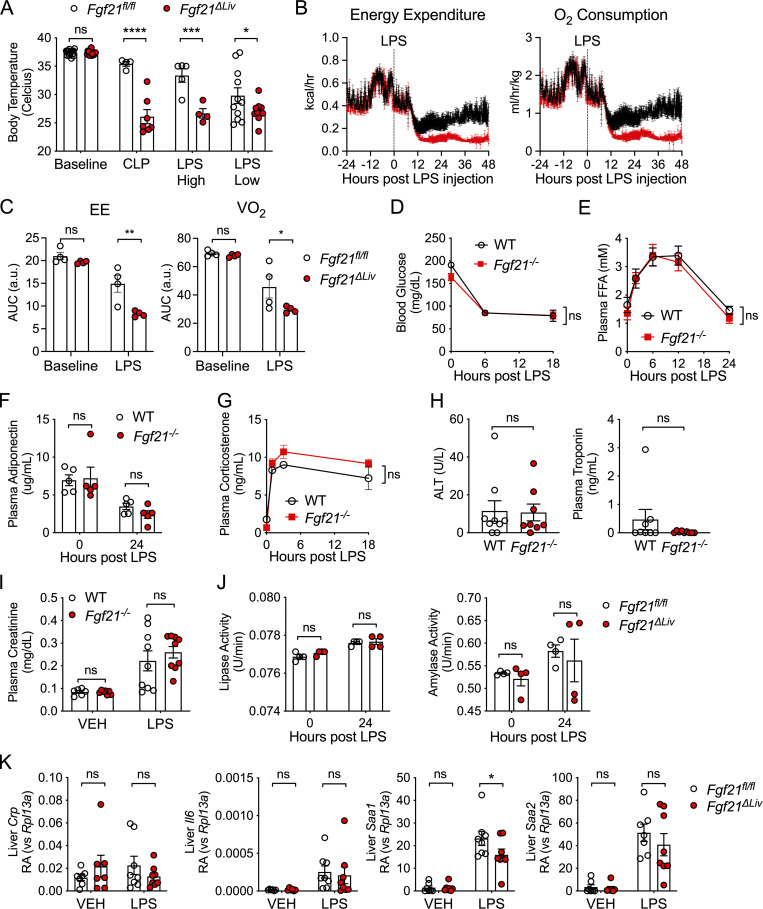
Figure 2.
FGF21 deficiency results in decreased body temperature after LPS challenge. (A) Rectal temperatures of Fgf21fl/fl and Fgf21ΔLiv mice 24 h after CLP, LPS high dose (10 mg/kg i.p.), and LPS low dose (5 mg/kg i.p.). n = 4–11/group; data are from one of two independent experiments (CLP, LPS high dose), and pooled data are from three independent experiments (LPS low). (B and C) Energy expenditure (EE) and oxygen consumption (VO2) before and after 2.5 mg/kg i.p. LPS challenge in Fgf21fl/fl and Fgf21ΔLiv mice. n = 4/group; data are from one of two independent experiments with similar results. (C) Area under the curve (AUC) from B. (D–H) WT and Fgf21−/− mice were challenged with 12.5 mg/kg i.p. LPS. (D) Blood glucose. n = 5/group; data are from one of four independent experiments with similar results. (E) Plasma free fatty acids (FFAs) by enzymatic assay. n = 5/group; data are from one of two independent experiments with similar results. (F) Plasma adiponectin measured by ELISA. n = 5/group; data are from one of two independent experiments with similar results. (G) Plasma corticosterone measured by ELISA. n = 3–4/group; data are from one of two independent experiments with similar results. (H) Alanine aminotransaminase (ALT) activity measured by enzymatic activity assay and troponin measured by ELISA 24 h after LPS. n = 8–9/group; pooled data are from two independent experiments. (I) Plasma creatinine measured by HPLC 24 h after PBS vehicle (VEH) or 10 mg/kg i.p. LPS in WT and Fgf21−/− mice, n = 6–9/group; pooled data are from two independent experiments. (J) Plasma lipase and amylase activity measured by enzymatic assay before and after LPS 5 mg/kg i.p. challenge; data are from one of two independent experiments with similar results. (K) mRNA expression in whole-liver tissue 20 h after vehicle or 5 mg/kg i.p. challenge, shown relative to Rpl13a. n = 7–8/group; pooled data are from two independent experiments. Data are expressed as mean ± SEM. *, P < 0.05, **; P < 0.01; ***, P < 0.001; ****, P < 0.0001; two-way ANOVA with Sidak’s multiple comparisons test (A, C–G, and I–K) or unpaired two-sided t test (H).

