Figure 2.
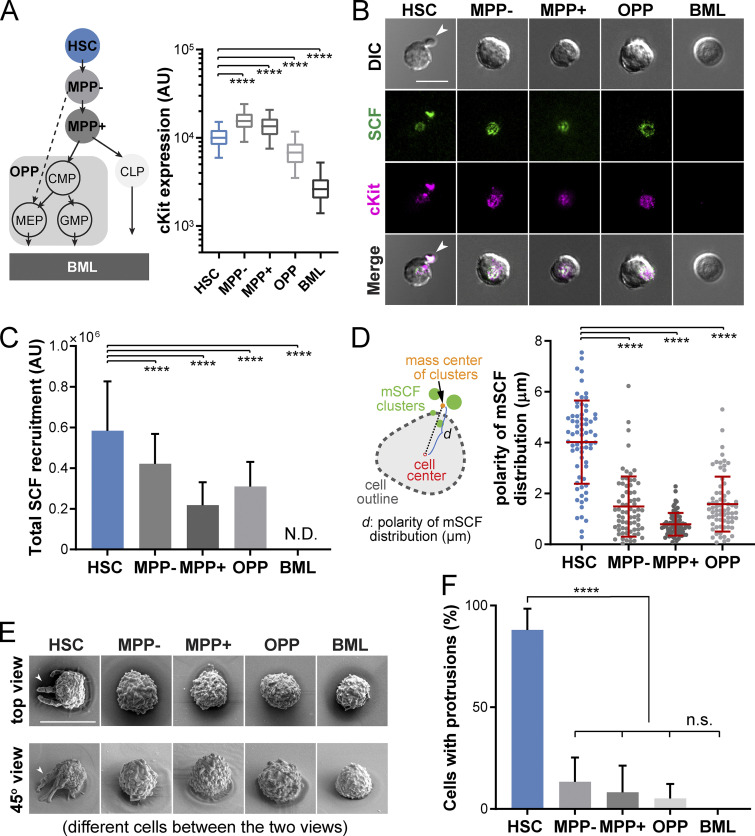
HSCs are highly efficient in recruiting mSCF with a distinct cell morphology. (A) Hematopoietic lineage hierarchy and the expression of cKit in five populations measured by flow cytometry (50,000 events in total). MPP−: Flk2− MPPs; MPP+: Flk2+ MPPs; BML, bone marrow Lin+CD45- cells. CMP, common myeloid progenitor; GMP, granulocyte-macrophage progenitor; MEP, megakaryocyte-erythrocyte progenitor. (B) The clustering patterns of mSCF and cKit under the five hematopoietic cell types after 1-h incubation on SLBs tethered with mSCF+VCAM-1. Arrowheads point to HSCs showing a polarized morphology with mSCF clustered under the cell protrusion. (C) Total mSCF per cell recruited by each cell type. n = 100–108 single cells per condition. N.D., not detected. (D) The polarity of mSCF distribution is defined as the distance between the mass center of mSCF clusters and the cell center. HSCs have the highest polarity of mSCF distribution among all the cKit+ HSPCs. n = 70 single cells per condition. (E) SEM micrographs of the five hematopoietic cells incubated on SLBs with mSCF+VCAM-1. Arrowheads point to HSCs that show unique polarized membrane protrusions (top row, top view; bottom row, 45° side view). (F) Frequency of cells with membrane protrusions of 2 µm or longer in SEM. n = 3–5 field of views per condition, with 3–10 single cells per field of view. Scale bars, 10 µm. Error bars represent SD. ****, P < 0.0001 by ANOVA with Tukey’s test.

