Figure 5.
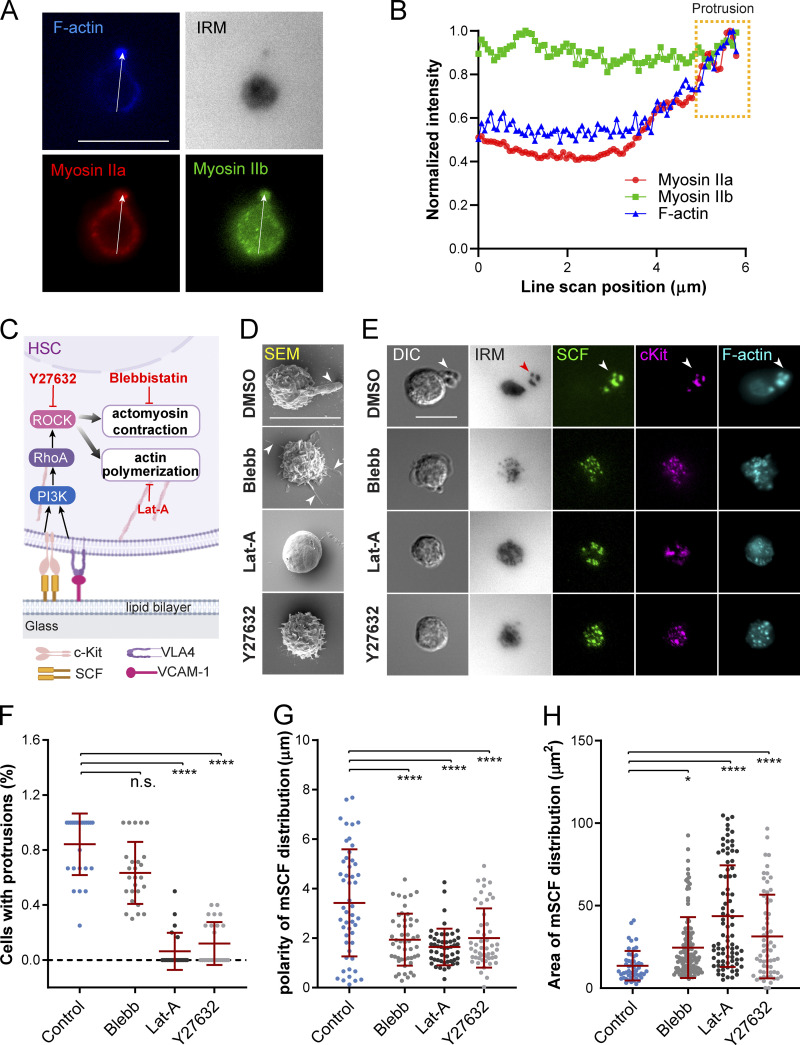
mSCF redistribution and morphological transition require cytoskeletal remodeling. (A) Immunostaining of myosin IIa and myosin IIb and counterstained F-actin in an HSC forming polarized morphology on an SLB with mSCF+VCAM-1. (B) Line scan of fluorescent intensities of the three cytoskeletal components as illustrated in A. The yellow box highlights the region of the protrusion. (C) ROCK signaling and cytoskeletal reorganization downstream of mSCF and VCAM-1 engagement and the corresponding inhibitors. (D) SEM images of HSCs pretreated with inhibitors for 1 h and then incubated with SLBs with mSCF+VCAM-1 for 1 h. Arrowheads indicate protrusions on HSCs. (E) Microscopic images of HSCs from the corresponding treated or nontreated conditions in D. Arrowheads (white and red) show colocalization of membrane protrusion with adhesion sites and clusters of cKit, mSCF, and F-actin. (F) Frequency of cells showing membrane protrusions ≥2 µm in SEM. n = 23–26 cells per condition. (G) Polarity of mSCF distribution under single HSCs. n = 50 cells per condition. (H) Area of the mSCF distribution under single HSCs. n = 59–84 single cells per condition. Scale bars, 10 µm. Error bars represent SD. *, P < 0.05; ****, P < 0.0001 by ANOVA with Tukey’s test (F–H).

