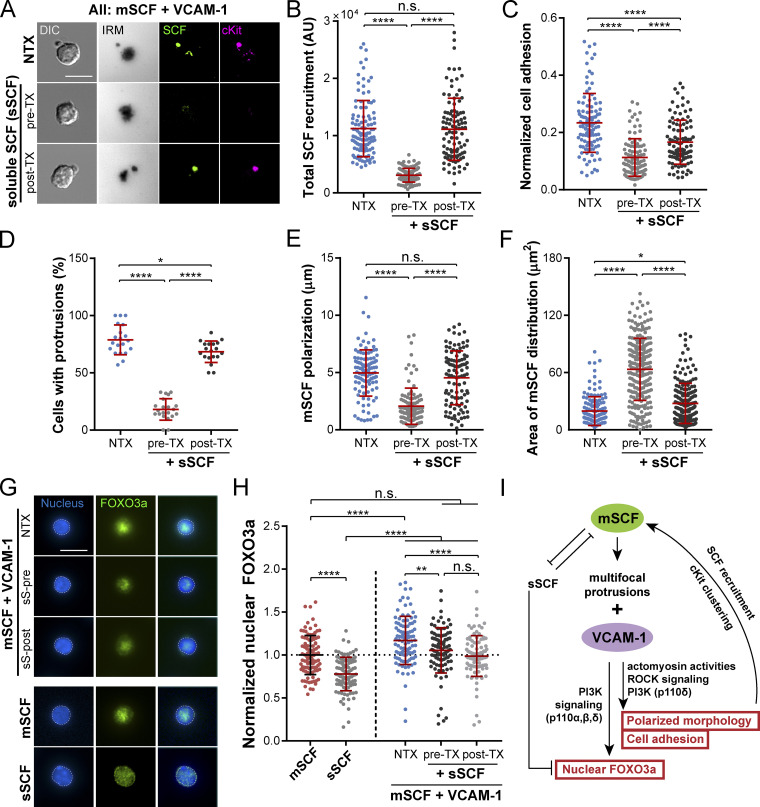
Figure 8.
sSCF competitively disrupts mSCF–VCAM-1 synergy. (A) HSCs incubated on SLBs with mSCF+VCAM-1 for 1 h. pre-TX, pretreated with 50 ng/ml sSCF on ice for 1 h (no washing) before loading onto SLB; post-TX, HSCs allowed to interact with SLB for 30 min before being treated with 50 ng/ml sSCF for 30 min. The total interaction time with SLBs was 1 h in all conditions. (B–F) Corresponding quantifications of total recruited mSCF by each cell (B; n = 103–109 single cells per condition), normalized cell adhesion (C; n = 100–104 single cells per condition), frequency of cells showing large membrane protrusions (in DIC; D; n = 19–21 images per condition with 6–23 cells per image), polarity of mSCF distribution (E; n = 105–107 single cells per condition), and area of mSCF distribution (F; n = 100 single cells per condition). (G) HSCs immunostained for FOXO3a (nuclei counterstained) after 12-h incubation on SLBs. (H) Intensities of nuclear FOXO3a immunostaining in single HSCs, normalized to the population average of the mSCF-alone condition. n = 100 single cells per condition. (I) Summarized mechanism of mSCF–VCAM-1 synergy and regulation of HSC morphology, adhesion, and nuclear FOXO3a. Scale bars, 10 µm. Error bars represent SD. n.s., P > 0.05; *, P < 0.05; **, P < 0.01; ****, P < 0.0001 by ANOVA with Tukey’s test (B–F and H). NTX, no treatment.

