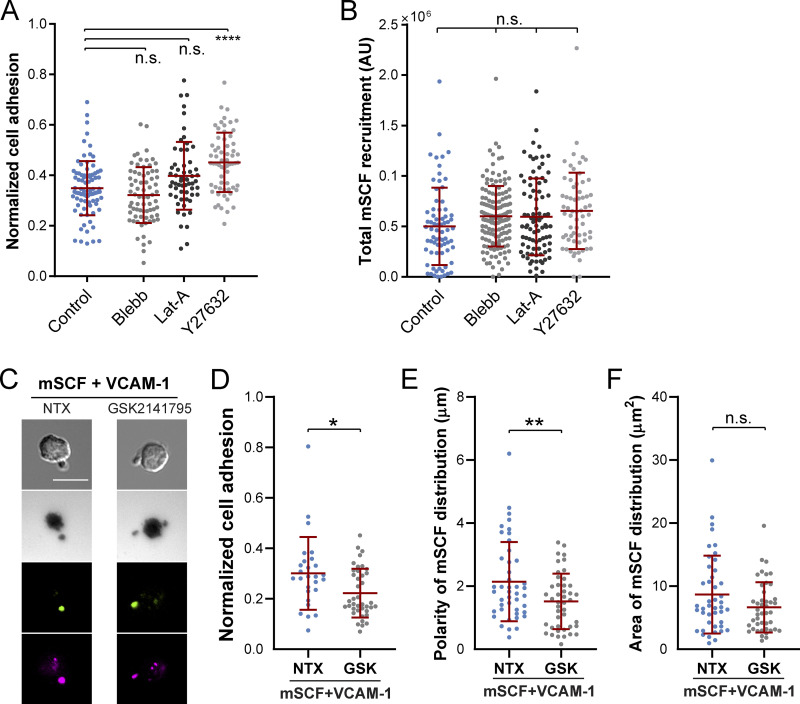
Figure S5.
Regulation of HSC adhesion and mSCF distribution by cytoskeletal and Akt inhibitors. (A) Impact of cytoskeletal inhibition on the normalized adhesion area in HSCs, which is assessed by the dark adhesion area in IRM divided by the cell area in DIC in each cell. n = 59–84 single cells per condition. n.s., P > 0.05; ****, P < 0.0001 by ANOVA with Tukey’s test. (B) None of the cytoskeletal inhibition affected the total recruitment of mSCF by HSCs assessed by the sum of fluorescence intensities of all pixels under single cells after background subtraction. n = 64–145 single cells per condition. (C) Images of HSCs on mSCF+VCAM-1 SLB without treatment (NTX) or with Akt inhibitor GSK2141795 (GSK). Scale bar, 10 µm. (B–D) Effect of GSK treatment on normalized cell adhesion (B), polarity of mSCF distribution (C), and area of mSCF distribution (D). n.s., P > 0.05; *, P < 0.05; **, P < 0.01 by unpaired two-tailed Student’s t test.

