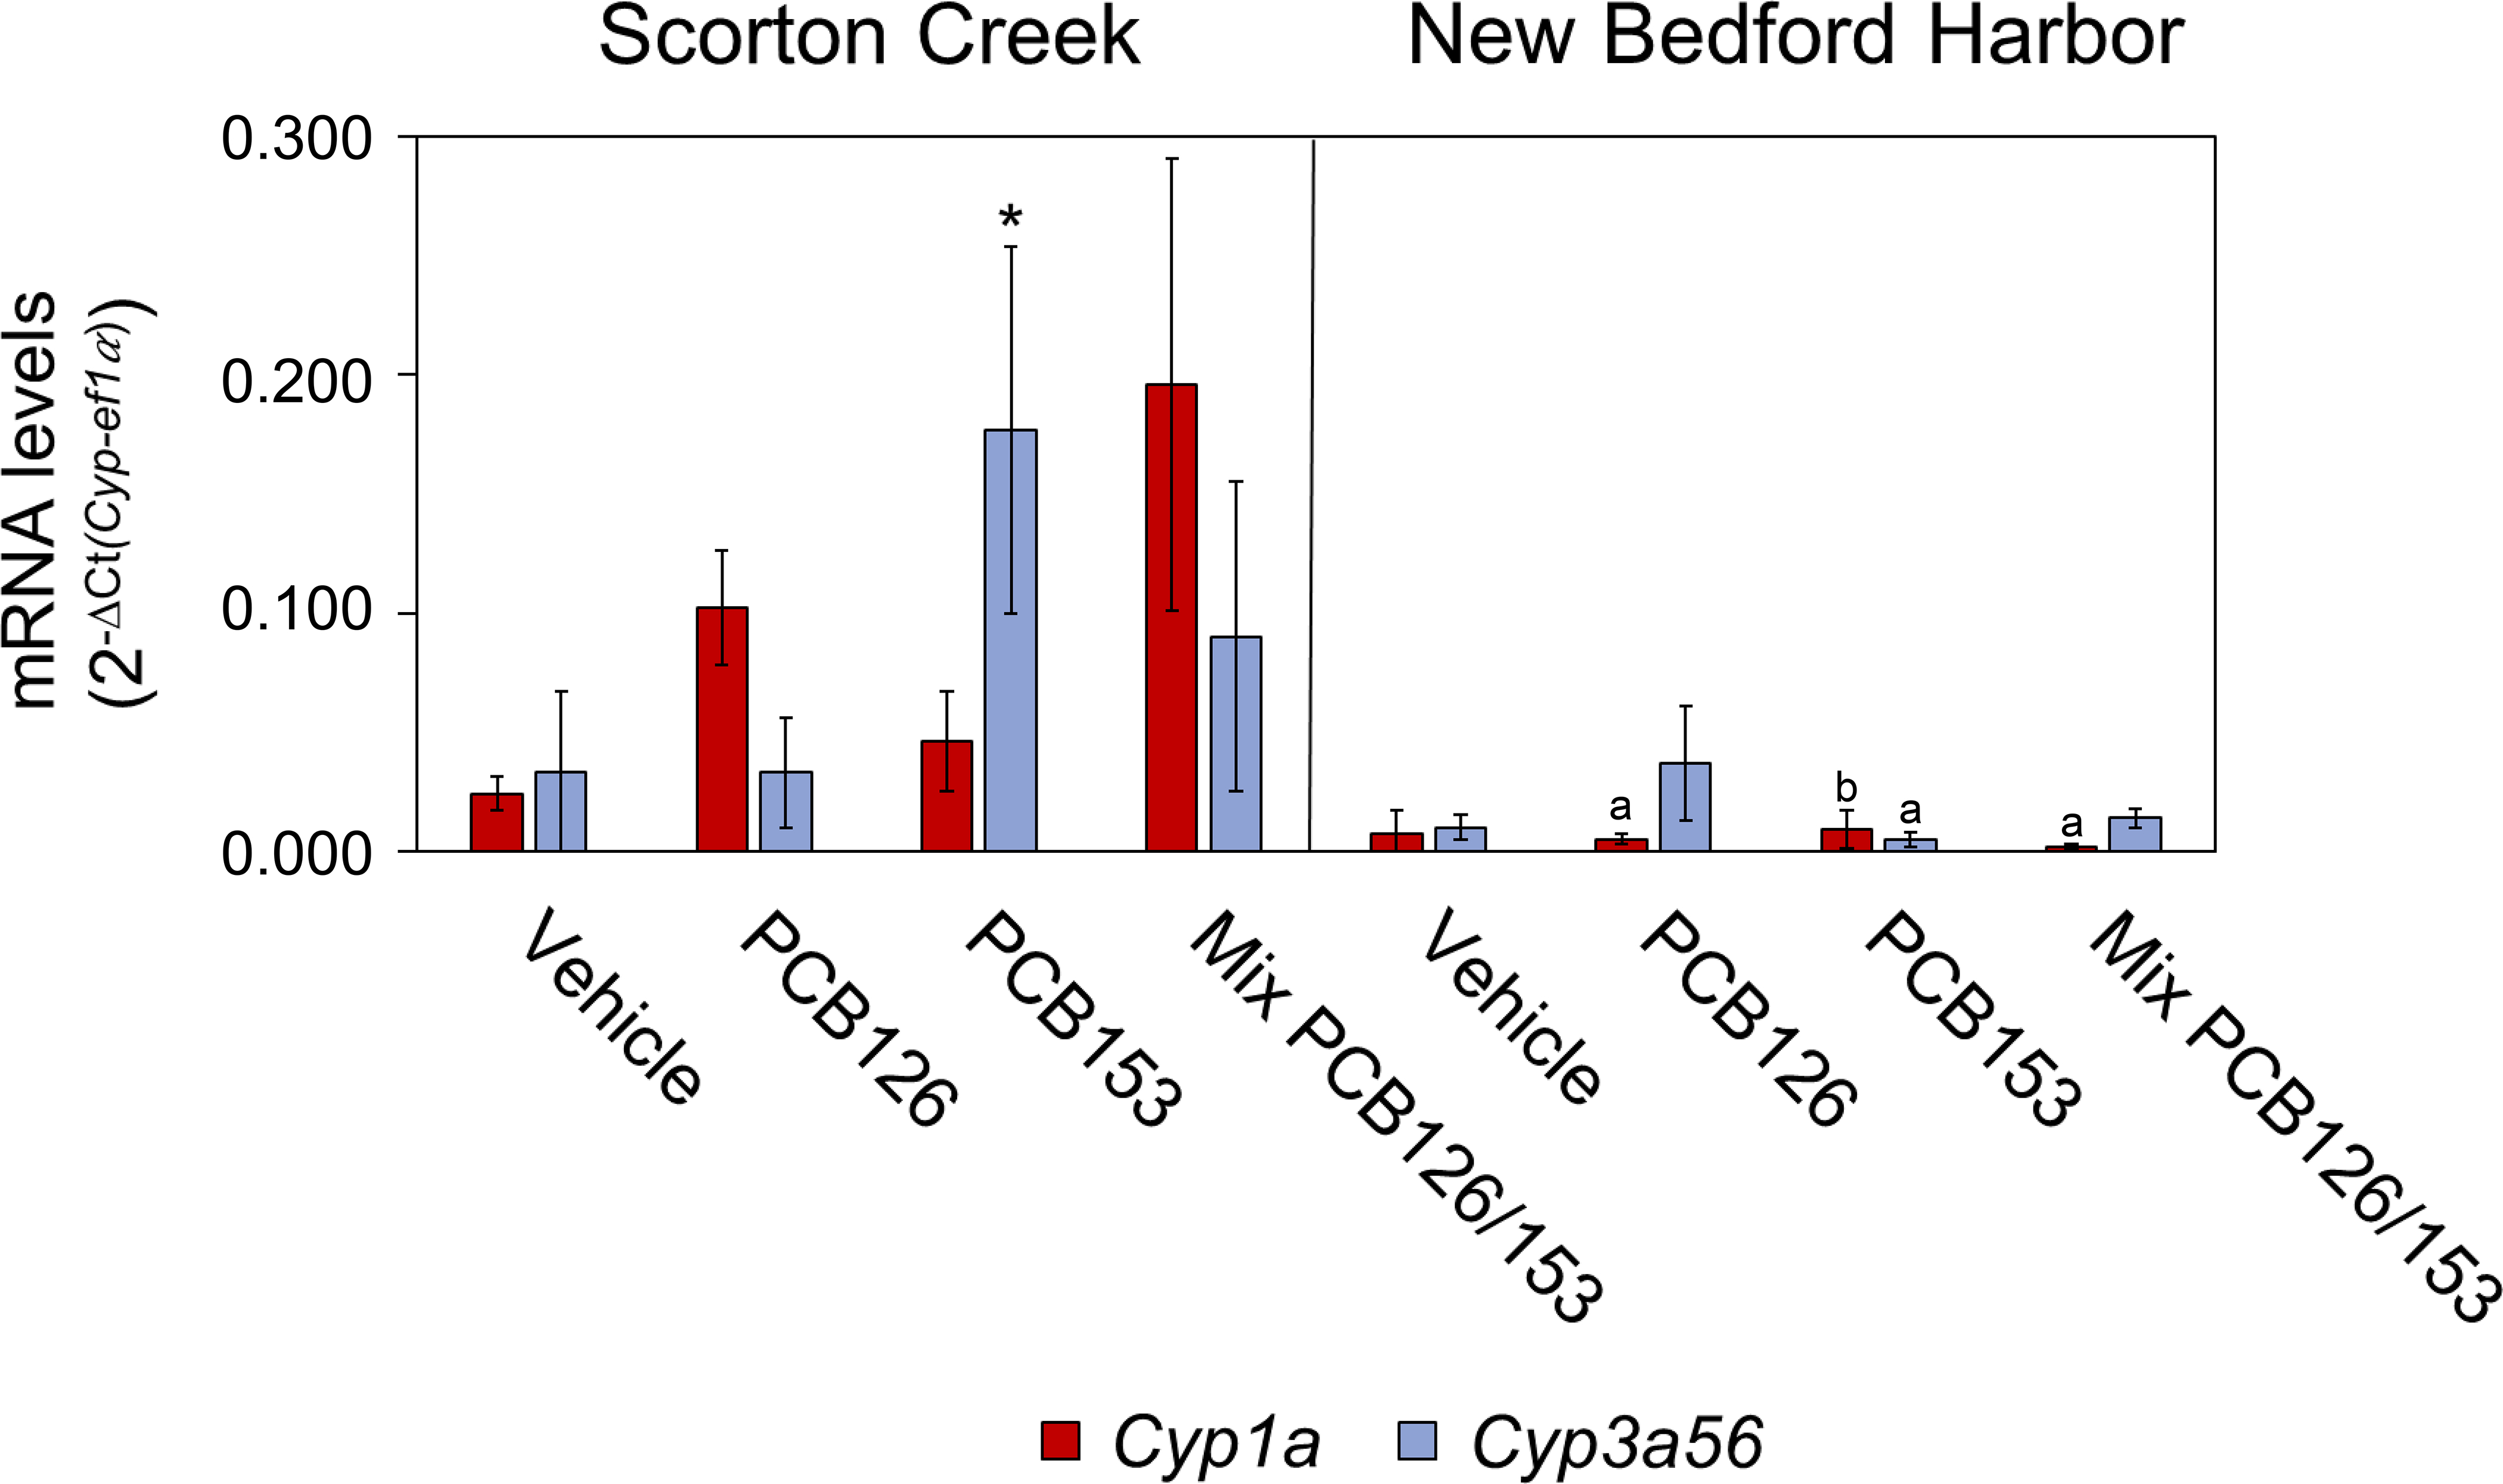
Figure 1.

Cyp1a and Cyp3a56 mRNA levels in gills in F1 generation female killifish from Scorton Creek population and in F2 generation female fish from the New Bedford Harbor population raised and exposed in the laboratory with PCB126, PCB153 or a mixture of both congeners. Each bar represents the mean of 3 to 5 fish ± standard deviation; * p < 0.05 compared to vehicle control in the Scorton Creek population; a p < 0.001 and b p < 0.05 population comparisons to the same treatment. The statistics for exposure comparisons within each population are provided in Table S1 and for population comparisons in Table S2. A scatterplot showing Cyp3a56 mRNA versus Cyp1a mRNA in female fish from both populations and the different treatments is provided in Figure S1.
