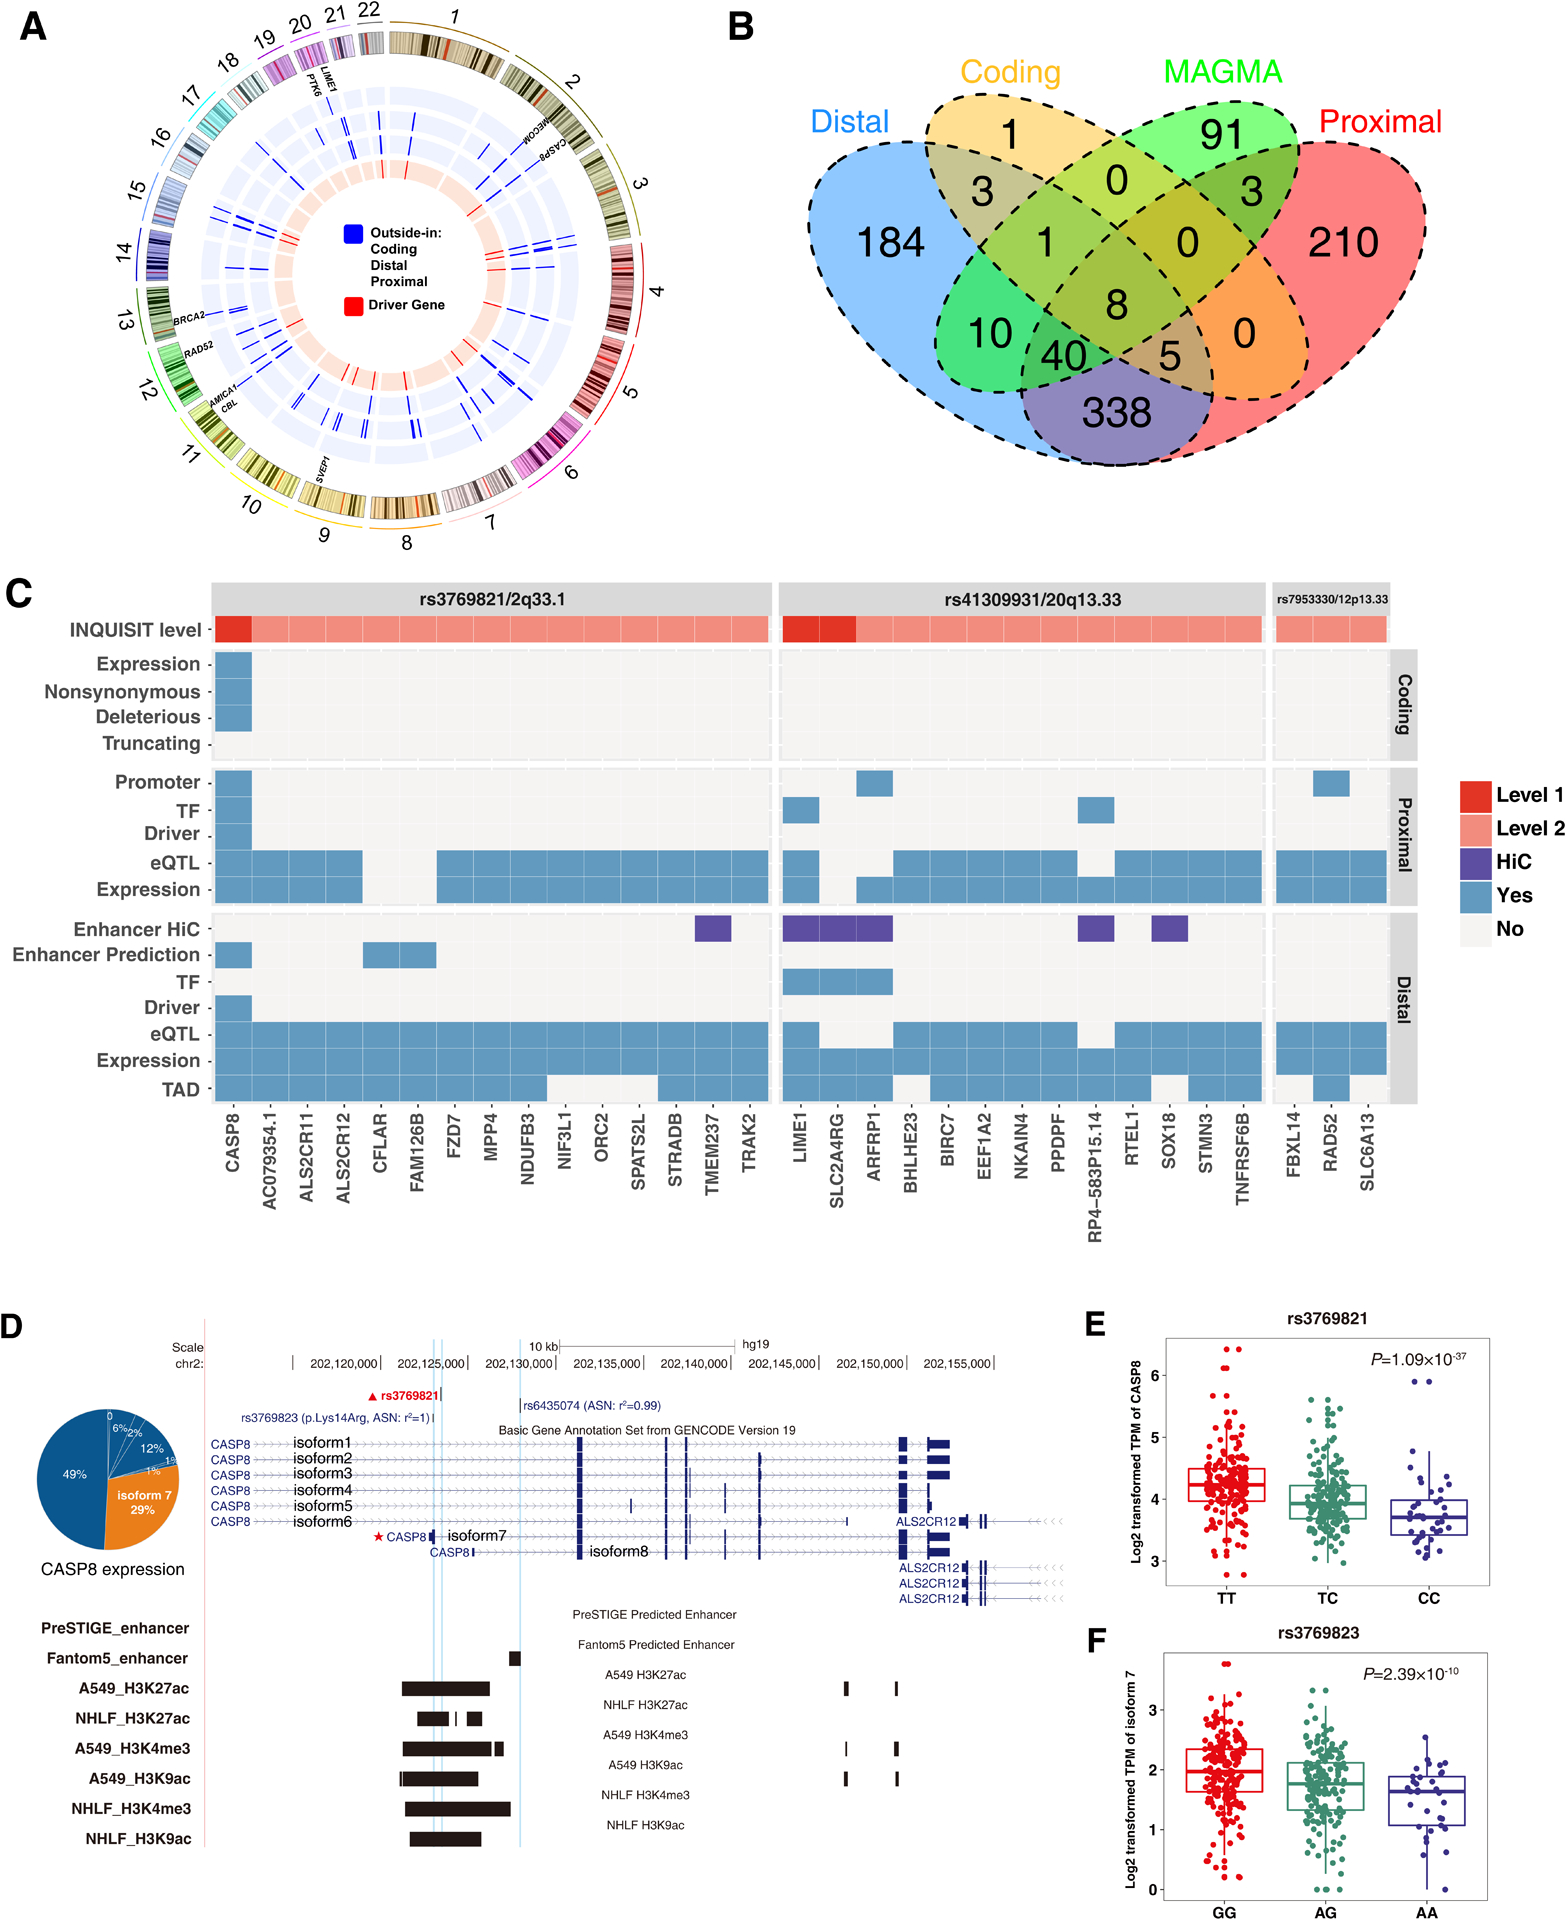
Figure 2. Implicated lung cancer target genes by functional annotation.

A. Circos plot showing 803 implicated genes by distal mapping, promoter mapping and coding mapping strategies.
Blue indicates the mapping strategy (from inside to outside: distal, promoter, and coding mapping) and red indicates if the implicated gene is a driver gene.
B. Venn diagram showing the number of overlapped genes implicated by distal mapping, promoter mapping, coding mapping strategies, and GWGAS.
C. Detailed functional annotation results for three risk loci of lung cancer.
The x-axis indicates the implicated genes, and y-axis indicates the annotation evidence types.
D. Genomic region of CASP8 in 2q33.1.
E-F. eQTL analysis of two CRVs (rs3769821 and rs3769823) and CASP8 expression in 383 GTEx lung tissues.
