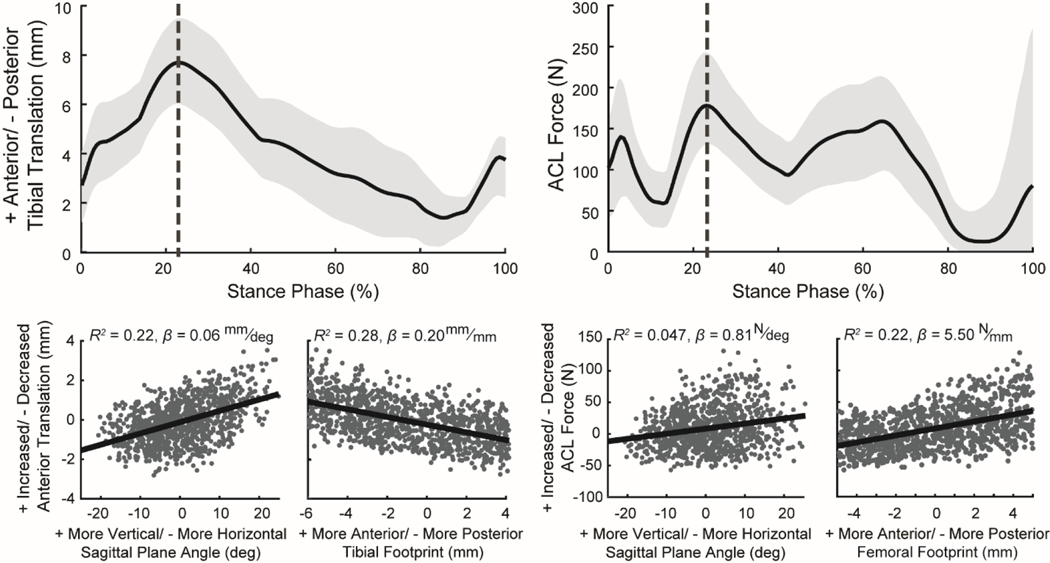
Figure 4:
Plots (top row) show the mean (black line) and the range between the 5th and 95th percentiles (light gray shaded region) for anterior tibial translation and ACL force during the stance phase of simulated walking for the 500 virtual ACL reconstructions (ACLR) with varying graft geometries, stiffnesses, and initial tensions. The scatter plots (bottom row) demonstrate the effect of changes in ACL graft tunnel locations and graft angle on anterior tibial translation and ACL force at the instance of peak ACL force during stance (vertical dotted gray line in top plots). Each point in the scatter plots was computed relative to the native model (virtual ACLR model minus native). Positive values indicate that the virtual ACLR model value was greater than that of the nominal model, and negative values indicate that the ACLR model value was less than that of the nominal model. Scatter plots include coefficient of determination (R2) and the slope of the least-squares linear regression (β) computed between the ACL reconstruction surgical factors and the knee mechanics metrics.

