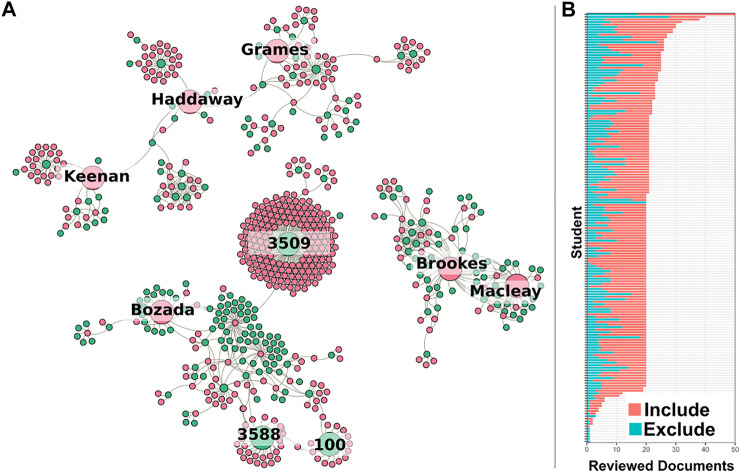
FIGURE 6.
(A) Three of the larger communities on sysrev.com. Pink nodes represent users, green nodes represent projects. Edges link projects with their users. Several notable projects and users have been enlarged for discussion. (B) Bar chart representing completed document reviews for each student in sysrev.com/p/3509, an educational review focused on evidence based toxicology by Dr. Lena Smirnova. Each bar represents a student, students were asked to complete a review of 20 documents, blue bars indicate excluded articles, red bars indicate included articles in an article screening exercise.

