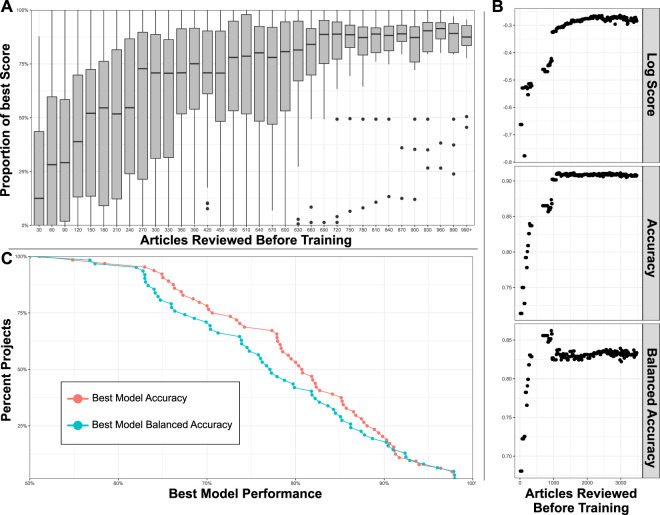
FIGURE 7.
(A) Box plots indicate distribution of model performance relative to the worst and best model in a given model’s project. Models are bucketed according to the number of articles labeled before model training. Models improve rapidly until 300 articles have been reviewed. (B) Accuracy metrics for a large sysrev reviewing insect population changes. Model performance is charted as a function of number of articles used in training, across 3 performance metrics, and evaluated on a consistent holdout set. (C) Best model accuracy and balanced accuracy evaluated in 64 sysrevs.

