
Fig. 1.
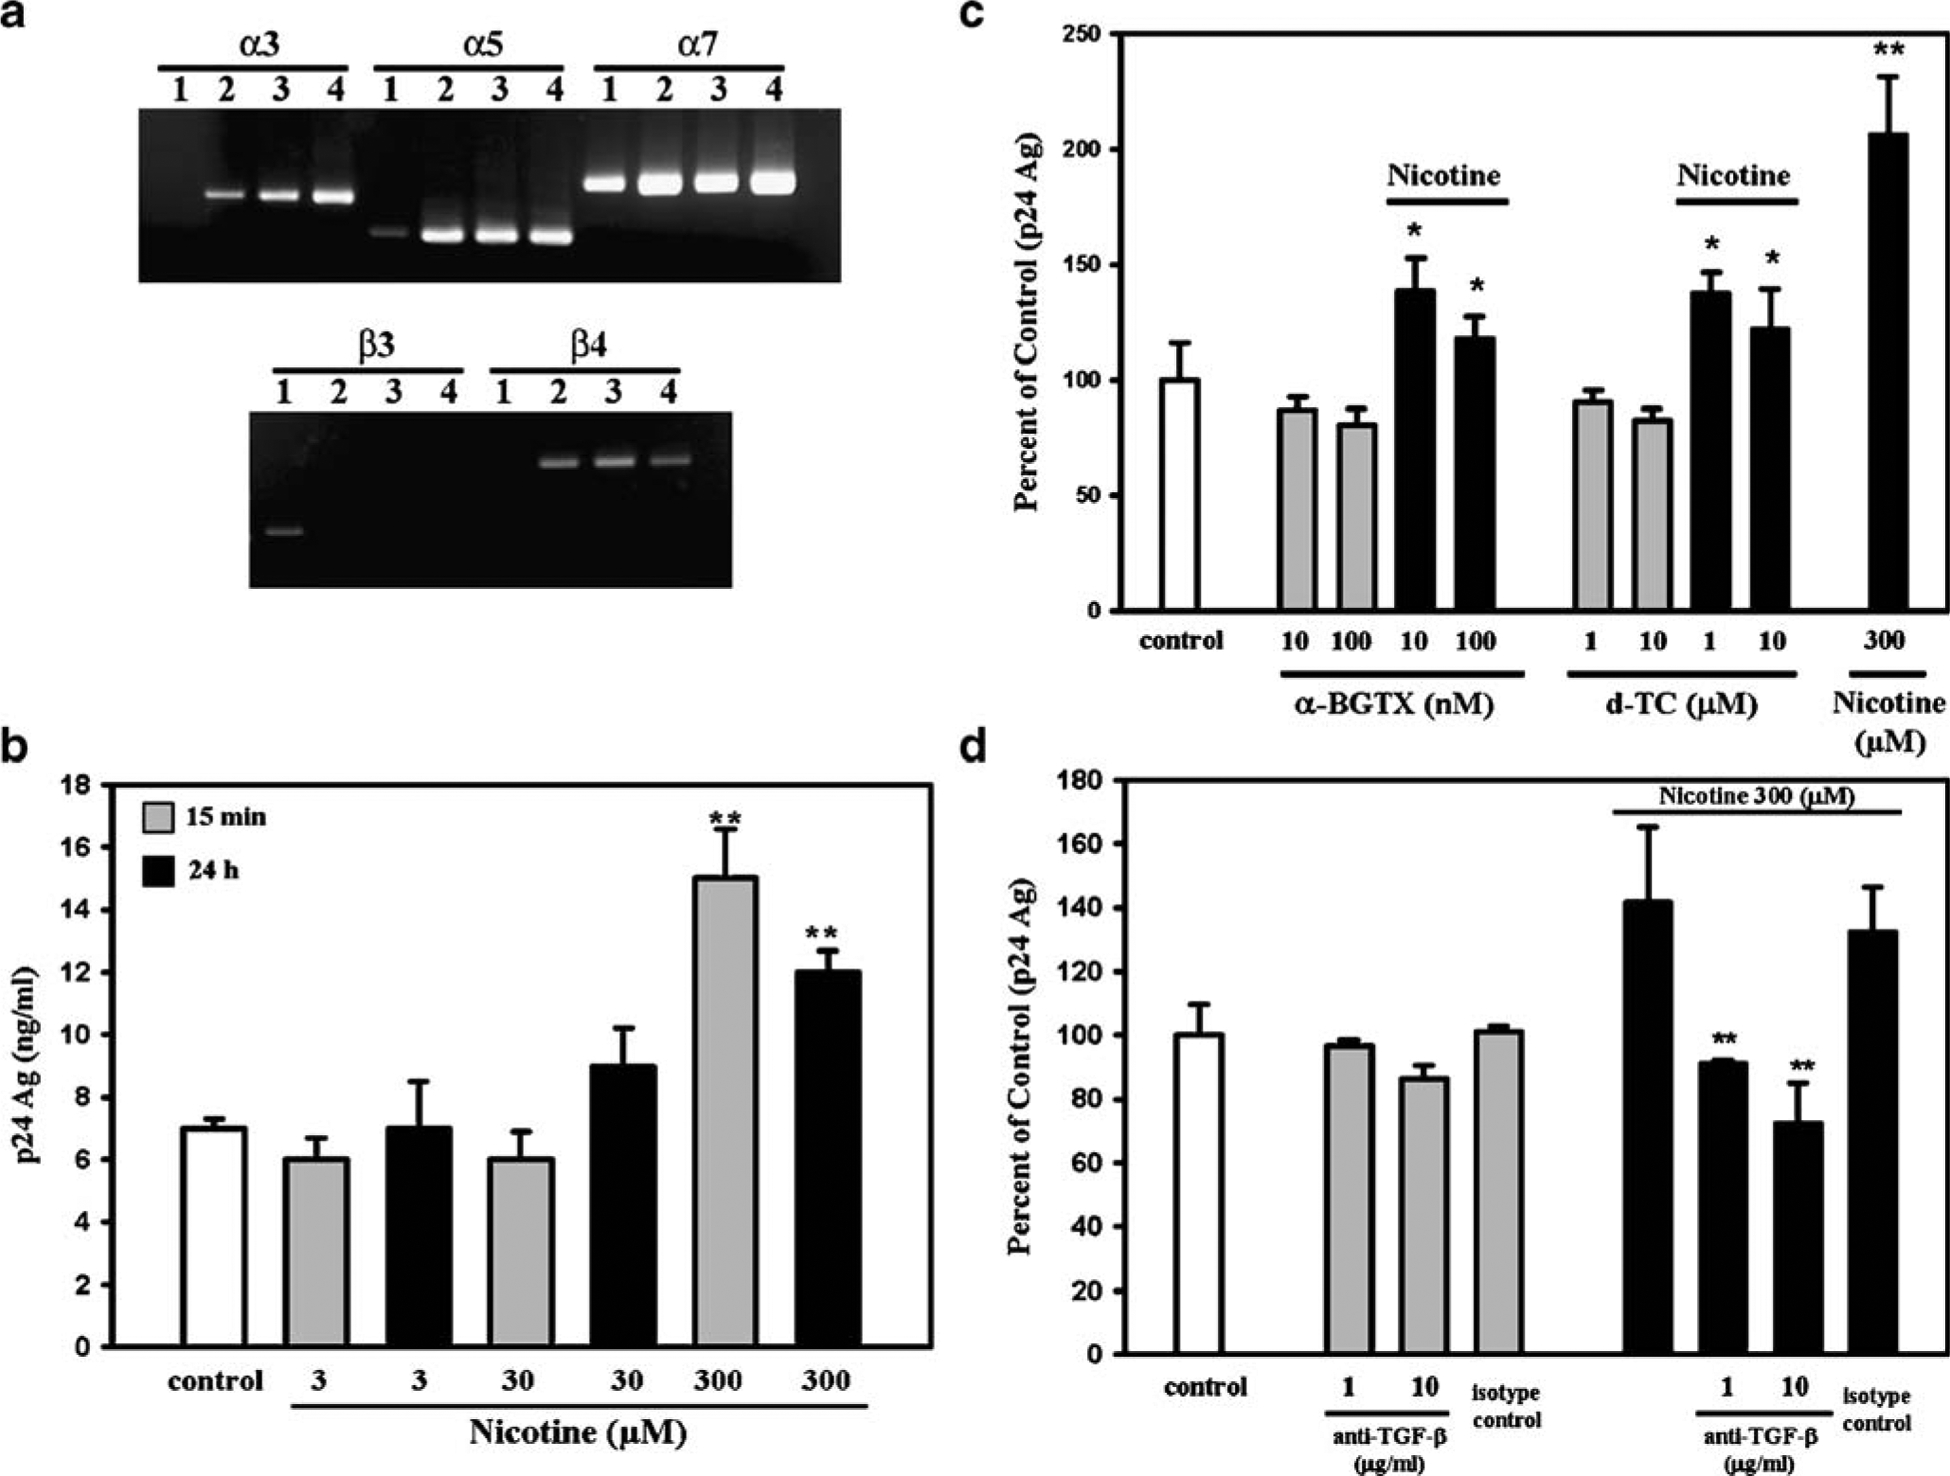
Nicotinic receptors and effects of nicotine on HIV-1 expression in microglia. a Constitutive expression of nAChRs in human microglial cells. A representative gel shows the presence of mRNA of α3, α5, α7, and β4 subunits. mRNA for the β3 subunit was absent. mRNA for subunits α4 and β2 were also absent (data not shown). Lanes 1 to 4 microglial cell cultures derived from four different brain tissue specimens. No PCR products were found in RT control of DNase-treated RNA (data not shown). b Effects of nicotine pretreatment on viral expression. Microglial cells were pretreated with nicotine for 15 min or 24 h at the indicated concentrations, followed by infection with HIV-1. After 7 days of infection, supernatants were then collected for measurement of p24 antigen (Ag) levels. Data are presented as the mean±SEM of three separate experiments using microglia from different brain specimens. **p<0.01 vs untreated (control) cells by Student’s t test. c Effects of α-BGTX and D-TC on nicotine pretreatment of HIV-1-infected microglia. Microglial cells were pretreated with nicotine for 24 h at 300 μM in the presence or absence of either α-BGTX or D-TC 30 min before at the indicated concentrations, followed by infection with HIV-1SF162. After 7 days of infection, supernatants were then collected for measurement of p24 Ag levels. Data are presented as the mean±SEM of five separate experiments using microglia from different brain specimens. *p<0.05 vs nicotine alone by Student’s t test; **p<0.01 vs untreated (control) cells by Student’s t test. d Role of TGF-β1 on nicotine effects on HIV-1-infected microglia. Microglial cells were pretreated with nicotine for 24 h at 300 μM in the presence or absence (isotype control) of anti-TGF-β1 antibodies 30 min before at the indicated concentrations, followed by infection with HIV-1SF162. After 7 days of infection, supernatants were then collected for measurement of p24 Ag levels. Data are presented as the mean±SEM of two separate experiments using microglia from different brain specimens. **p<0.01 vs nicotine alone by Student’s t test