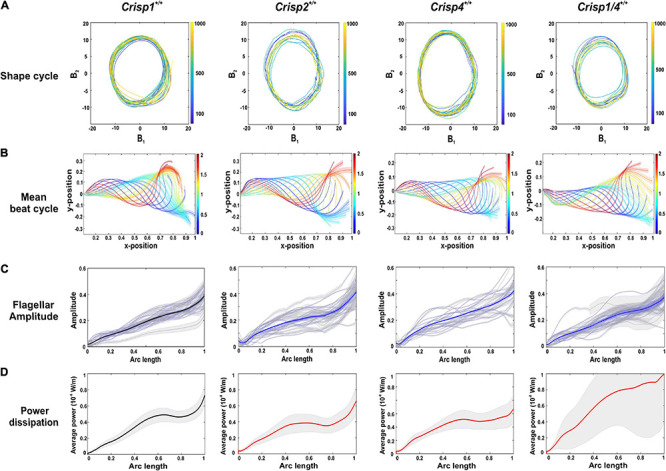
FIGURE 1.

Analysis of flagellar oscillations and kinetics across sperm from wild type mouse strains. (A) A representative analysis of the shape cycle in B-space of flagellar betting over time as visualized by plotting coefficients (B1 and B2), the two most highly contributing POD modes (ψ1 and ψ2), against each other across the analyzed 1,000 frames. (B) A reconstruction of a representative beat cycle of sperm flagellum waveform from wild type mice from each strain. The error bars along the flagella indicates the ±SD in the sample. All lengths, including positional coordinates and the arc-length coordinate are normalized by the total sperm body length. The color spectrum represents the dimensionless fraction of the mean time-period. (C) Normalized spermatozoa flagellar beating amplitude from each mouse strain examined. Gray lines indicate the flagellar amplitude of individual sperm sample and blue lines indicate the mean flagellar amplitude. The gray zone along the flagella indicates the ± SEM in the sample. (D) An analysis of power dissipation (10–8 W/m) along the flagella. The bold line indicates averaged data across the sperm population ± SEM indicated in the gray zone. Crisp1+/+ is denoted in black bold line as this will used as representative graph for comparison with knock out mice. Crisp2+/+, Crisp4+/+, and Crisp1/4+/+ are denoted in bold red lines. For all of (A–D) the strain from which wild type mice and sperm were derived is indicated above each column and a total of N = 25–30 sperm/mouse strain were analyzed.
