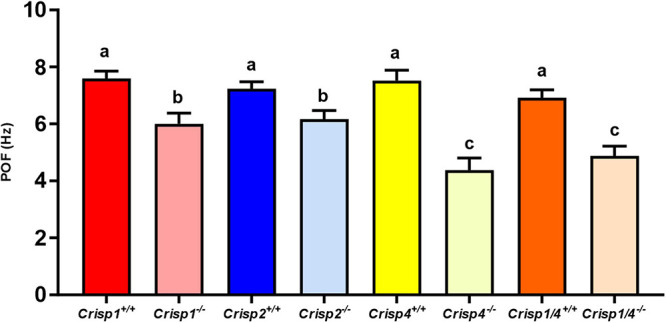
FIGURE 2.

The calculated primary oscillating frequency (POF) for sperm from wild type and Crisp knock out mice. The data presented is 25–30 sperm/genotype. N = 5–6 mice/genotype. Different letters indicate significant differences between groups, where significance is measured relative to the strain-specific wild type. P < 0.01 for all marked “b”; and P < 0.001 for all marked “c” as determined using a two-way ANOVA. The intense color bars represent Crisp wild type mice data and lighter version of the same color bars represents Crisp knock out mice data, respectively (CRISP1 – red, CRISP2 – blue, CRISP4 – yellow, and CRISP1/4 – orange).
