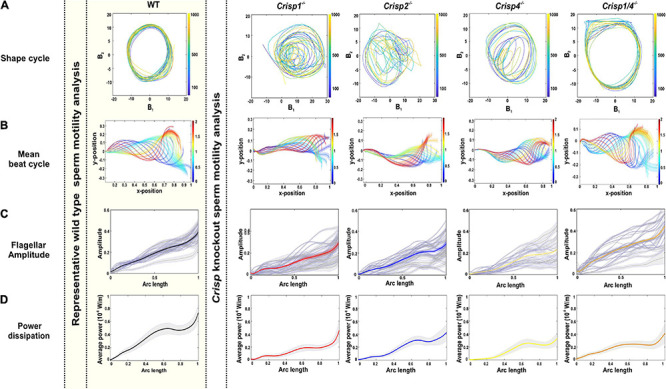
FIGURE 3.

Effects of loss of CRISP1, CRISP2, CRISP4, and CRISP1/4 on sperm flagellar beating pattern. (A) The representative shape cycles of the flagellar beating across Crisp knockout mice. (B) Reconstruction of mean beat cycle of sperm across knock out mouse genotypes. N = 25–30 sperm/genotype were analyzed, and representative mean beat cycles are shown. The color spectrum represents the non-dimensional time scale. (C) Analysis of flagellar beating amplitude from sperm from individual knock out mouse genotypes. Gray lines indicate the flagellar amplitude of individual sperm and the respective bold lines indicate the mean flagellar amplitude. Crisp1–/– data is red, Crisp2–/– data is blue, Crisp4–/– data is yellow and Crisp1/4–/– data is orange (D) Analysis of power dissipation (10–8 W/m) along the flagella. The bold line indicates averaged data across the sperm population ± SEM indicated in gray zone. Mouse genotype is indicated above each column. For simplicity, Crisp1 wild type data is shown as representative data for all wild types (within the shaded yellow box). Crisp1–/– data is red, Crisp2–/– data is blue, Crisp4–/– data is yellow and Crisp1/4–/– data is orange.
