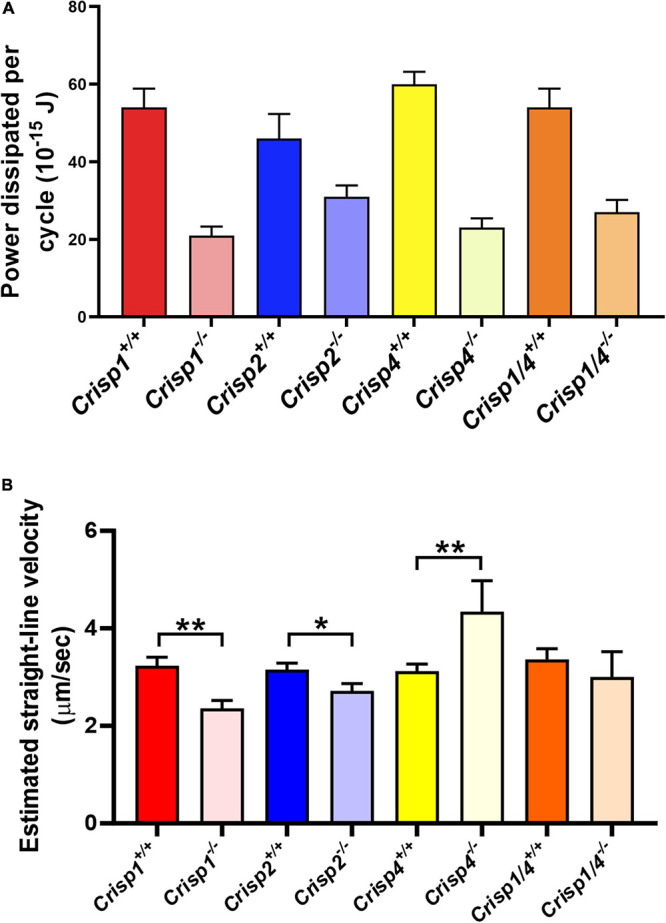
FIGURE 5.

Mathematical estimation of flagellar kinetics of sperm across multiple genotypes. (A) The average hydrodynamic power dissipation (10–15 J) rate from spermatozoa from individual mouse strains as a function of genotype. The data presented is from a total number of 25–30 sperm/genotype. N = 5–6 mice/genotype. Data analyzed by two-way ANOVA (±SD) on the mean sperm value from individual mice across genotypes. The intense color bars represent Crisp wild type mice data and lighter version of the same color bars represents Crisp knock out mice data, respectively (CRISP1 – red, CRISP2 – blue, CRISP4 – yellow, and CRISP1/4 – orange). For all the possible interactions between wild type vs. knock out genotype please refer to Supplementary Tables 5, 5.1. (B) The calculated net progressive velocity (μm/sec) of sperm plus or minus the presence of individual CRISP genes. Data presented is from a total of 25–30 sperm/genotype. N = 5–6 mice/genotype, *P < 0.05, **P < 0.01, ***P < 0.001, and ****P < 0.0001 as analyzed by unpaired Student t test. Data presented as mean ± SD. The intense color bars represent Crisp wild type mice data and lighter version of the same color bars represents Crisp knock out mice data, respectively (CRISP1 – red, CRISP2 – blue, CRISP4 – yellow, and CRISP1/4 – orange).
