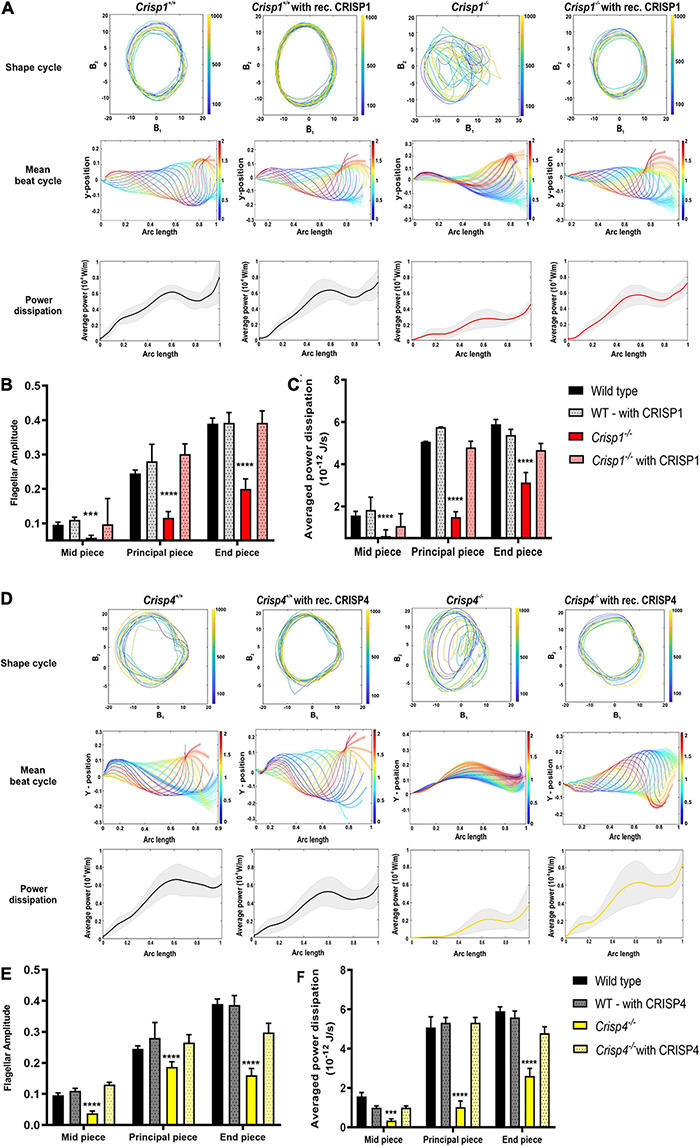
FIGURE 6.

Effects of recombinant epididymal CRISPs on sperm from Crisp1 and Crisp4 wild type and knock out mice. (A) The representative shape cycles of sperm flagellar beating, reconstruction of mean beat cycle and analysis of power dissipation (10–8 W/m) along the flagella of the sperm from Crisp1 wild type (black) and knock out (red) mice before (solid bar) and after (dotted bar) exposure to recombinant CRISP1 protein. N = 10–15 sperm/genotype were analyzed, and representative mean beat cycle and shape cycles of the flagellar beating is shown. For power dissipation, the black bold line indicates averaged data across the analyzed sperm population ± SEM. (B) Analysis of flagellar amplitude along the different regions of flagella (mid-piece, principal piece, and end piece) in sperm from Crisp1 wild type and knock out mice before and after exposure to 1 μM recombinant CRISP1 protein. See Supplementary Table 7.1 for all the possible interactions between exposed and non-exposed genotype. (C) Analysis of power dissipation (10–12 J/s) along the different regions of flagella (mid-piece, principal piece, and end piece) in sperm from Crisp1 wild type and knock out mice before and after exposure to 1 μM recombinant CRISP1 protein. The data presented is from a total number of 10–15 sperm/genotype. *** indicates P < 0.001 as analyzed by two-way ANOVA ± SEM. **** indicates P < 0.0001 as analyzed by two-way ANOVA ± SEM. See Supplementary Table 7.2 for all the possible interactions between exposed and non-exposed genotype. (D) The representative shape cycles of the flagellar beating, reconstruction of mean beat cycle and analysis of power dissipation (10–8 W/m) along the flagella of the sperm from Crisp4 wild type (black) and knock out (yellow) mice before (solid bar) and after (dotted bar) exposure to 1 μM recombinant CRISP4 protein. N = 10–15 sperm/genotype were analyzed, and representative mean beat cycle and shape cycles of the flagellar beating is shown. For power dissipation, the black bold line indicates averaged data across the analyzed sperm population ± SEM. (E) Analysis of flagellar amplitude along the different regions of flagella (mid-piece, principal piece, and end piece) in sperm from Crisp4 wild type and knock out mice before and after exposure to 1 μM recombinant CRISP4 protein. See Supplementary Table 8.1 for all the possible interactions between exposed and non-exposed genotype. (F) Analysis of power dissipation (10–12 J/s) along the different regions of flagella (mid-piece, principal piece, and end piece) in sperm from Crisp4 wild type and knock out mice before and after exposure to1 μM recombinant CRISP4 protein. The data presented is from a total number of 10–15 sperm/genotype. *** indicates P < 0.001 as analyzed by two-way ANOVA ± SEM. **** indicates P < 0.0001 as analyzed by two-way ANOVA ± SEM. See Supplementary Table 8.2 for all the possible interactions between exposed and non-exposed genotype. All representative videos can be access via doi: https://doi.org/10.26180/5dbf4bff1acce.
