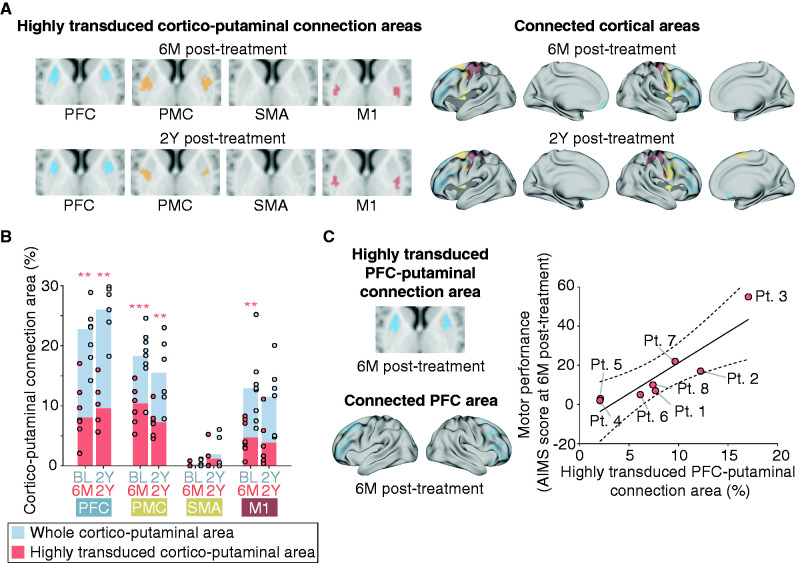
Figure 4.
Connection areas between structural regions of motor system and highly transduced putamen and its association with gross motor improvement. (A) Highly transduced cortico-putaminal connection areas and connected cortical areas in the motor system across patients. Black-coloured areas in the cortical model represent the cortical areas except PFC, PMC, SMA and M1 that connected to the highly transduced putaminal area. (B) Highly transduced cortico-putaminal connection area in the motor system. Gray-coloured bars represent the whole cortico-putaminal connection area at baseline and 2Y post-treatment. Pink-coloured bars represent the highly transduced cortico-putaminal connection area at 6M and 2Y post-treatment (see Fig. 3 for details). Pink-coloured asterisks represent the significant volumes of the highly transduced cortico-putaminal connection area. **P < 0.01, ***P < 0.001. (C) Relationship between the highly transduced prefrontal cortico-putaminal connection area and motor performance at 6M post-treatment. Putaminal and cortical images represent the highly transduced cortico-putaminal connection areas and cortical areas connecting to the putaminal area across patients, respectively. The raw data are plotted in the right panel. For the partial correlation analysis, the age of the treatment was adopted. Dashed line: 95% confidence interval.

