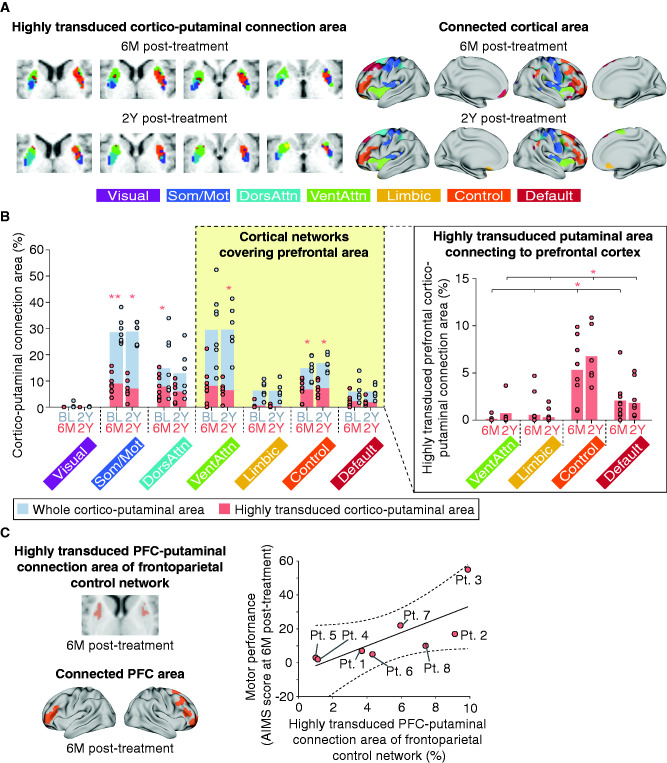
Figure 5.
Connection areas between cortical networks and highly transduced putamen and its association with gross motor improvement. (A) Representative examples of highly transduced cortico-putaminal connection areas from Pt. 1 and cortical areas connecting to the highly transduced putaminal area across patients (see Supplementary Figs 6 and 7 for details). Som/Mot: somato/motor network; DorsAttn: dorsal attention network; VentAttn: ventral attention network; Control: frontoparietal control network. (B) The whole cortico-putaminal connection area (left panel) and highly transduced prefrontal cortico-putaminal connection area (right panel) of seven cortical networks. Gray-coloured bars represent the whole cortico-putaminal connection area at baseline and 2Y post-treatment. Pink-coloured bars represent the highly transduced cortico-putaminal connection area at 6M and 2Y post-treatment (see Fig.3 for details). Pink asterisks in the left and right panels represent significant volumes of highly transduced cortico-putaminal connection area (Supplementary Table 3) and significant difference between the prefrontal cortico-putaminal connection area of the frontoparietal control network and that of the other cortical networks (Supplementary Table 4). *P < 0.05, **P < 0.01. (C) Relationship between the prefrontal cortico-putaminal connection area of the frontoparietal control network and the motor performance at 6M post-treatment. The raw data are plotted in the right panel. Partial correlation analysis was performed after adjustment for patient age at the time of treatment.

