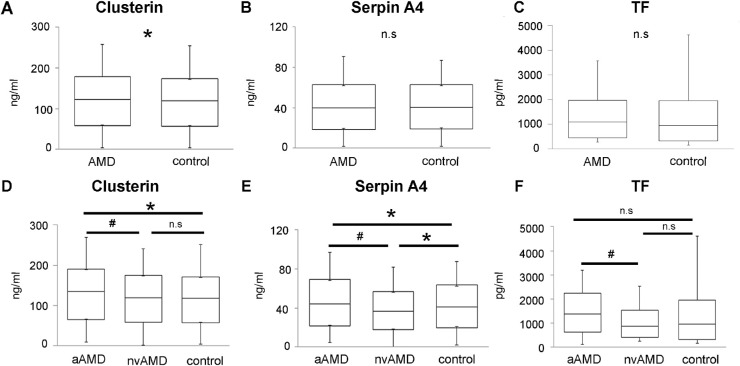
Figure 2.
Validation of differential protein expression. Multiplex ELISA was utilized to measure expression levels of nine proteins identified as differentially expressed in nvAMD AH according to MS1. The box plots show confirmed differential expression (the full data is presented in Supplementary Table S1). The comparison between the control group (n = 20), and AMD samples (aAMD, n = 15, and nvAMD, n = 15) shows in panels A, B and C. Panels D, E, and F shows protein expression in AMD subtypes as compared to the control group. * indicates P < 0.05. # indicates P < 0.05 between aAMD and nvAMD.

