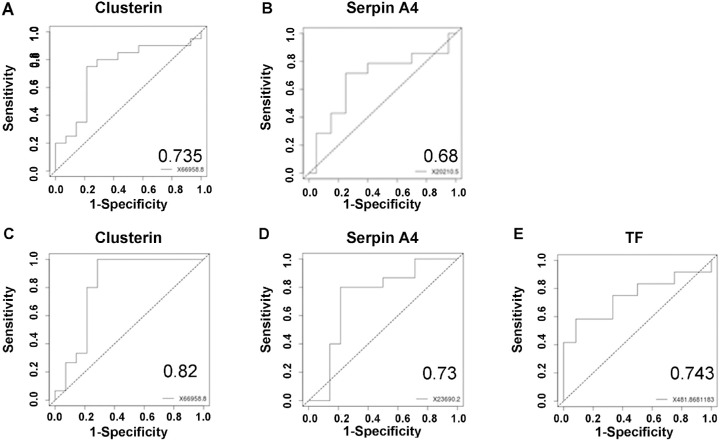
Figure 3.
ROC analysis. To validate the clinical significance differential protein expression in AH, we performed ROC analysis (area under the curve, AUC) of all nine proteins tested via ELISA based on 20 controls, 15 aAMD, and 15 nvAMD. Presented here are the top ranking AUCs (the complete list of values is presented in Supplementary Table S2). Panel A shows the AUC of clusterin for distinction of aAMD patients from controls. Panel B shows the AUC of Serpin A4 for distinction of controls from nvAMD patients, and Panels C, D, and E show the AUCs of clusterin, Serpin A4, and TF, respectively, for distinction of aAMD patients from nvAMD patients. Each AUC graph represents sensitivity versus 1-specificity.

