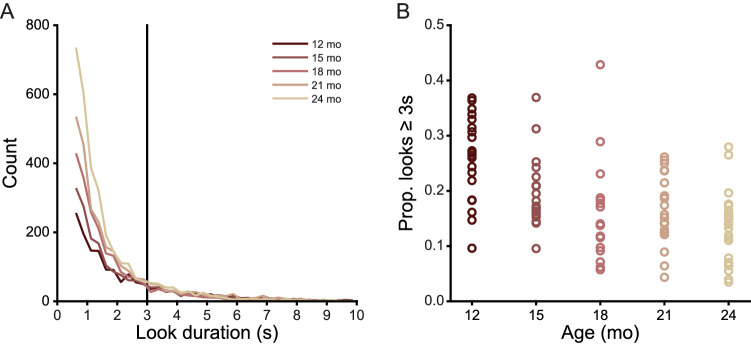
Figure 2.
Look duration decreases from 12 to 24 months. (A) Histograms showing the distribution of look durations less than 10 seconds at each age level. Vertical black line indicates the three-second cutoff for short and long looks. (B) Proportion of looks greater than or equal to three seconds in duration for each individual in each age group.

