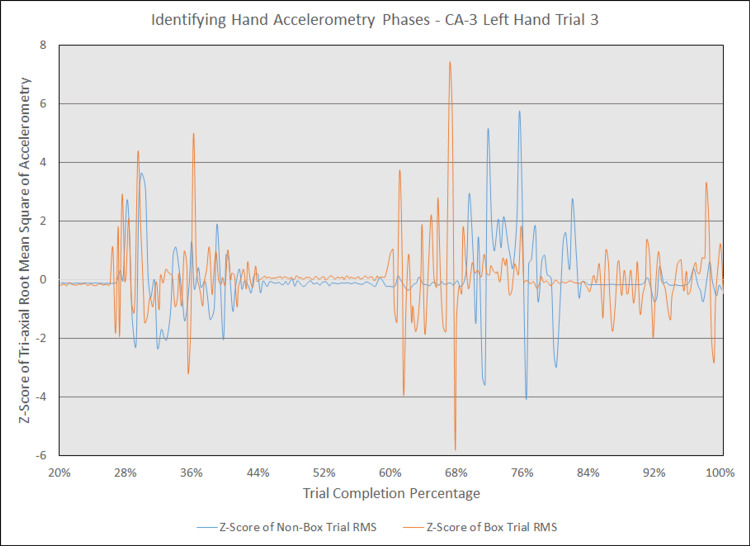
Figure 15. Identifying hand accelerometry phases - CA-3 left hand trial 3.
The above graph highlights the phases at which general accelerometry peaked in the left hand for a third-year anesthesiology resident (CA-3)'s third trial without an aerosol box, compared to that for their corresponding third trial with an aerosol box. The y-axis measures the z-scores of the root mean square (RMS) of accelerometry values from all three axes' at a given point, with the z-scores derived from the mean and standard deviation of a respective trial. The x-axis measures the trial completion percentage, calculated by dividing the time elapsed at any given point by the respective trial's total trial duration. The x-axis starts at the 20% trial completion percentage, as values prior to that point are relatively stable with virtually no change in z-scores. This graph is notable for three phases of increased accelerometry, which begin around the 28% completion point, 60% completion point, and 84% completion point. Although the trials were not completely in phase with one another, the line representing the trial with the aerosol box (depicted in orange) is notable for having more prominent activity peaks than the line representing the trial without an aerosol box (depicted in blue).

