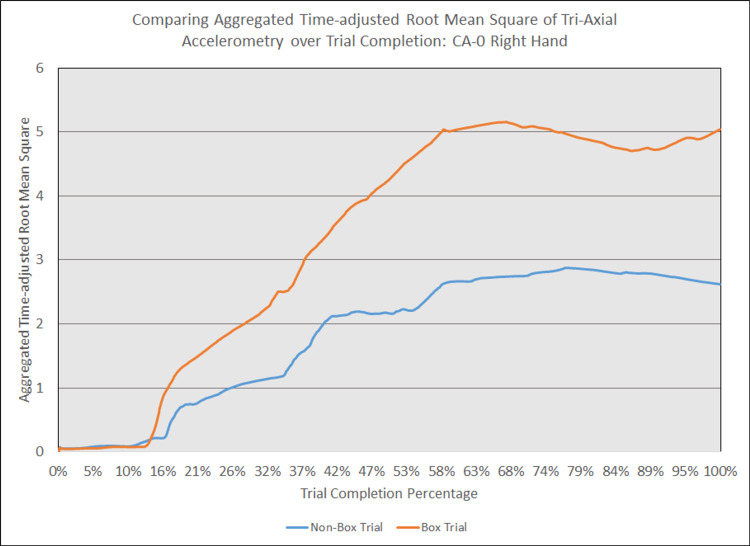
Figure 8. Comparing aggregated time-adjusted root mean square of tri-axial accelerometry over trial completion: CA-0 right hand.
The above graph displays the aggregate general accelerometry measured in the right hand for an intern in the anesthesiology residency program (CA-0)'s trial without an aerosol box, compared to that for their corresponding trial with an aerosol box. The y-axis measures the aggregated time-adjusted root mean squares of accelerometry values from all three axes' over a trial's duration. The x-axis measures the trial completion percentage, calculated by dividing the time elapsed at any given point by the respective trial's total trial duration. The blue line (bottom line at the end of the trial) depicts the trial without an aerosol box, while the orange line (top line at the end of the trial) depicts the corresponding trial with an aerosol box.

