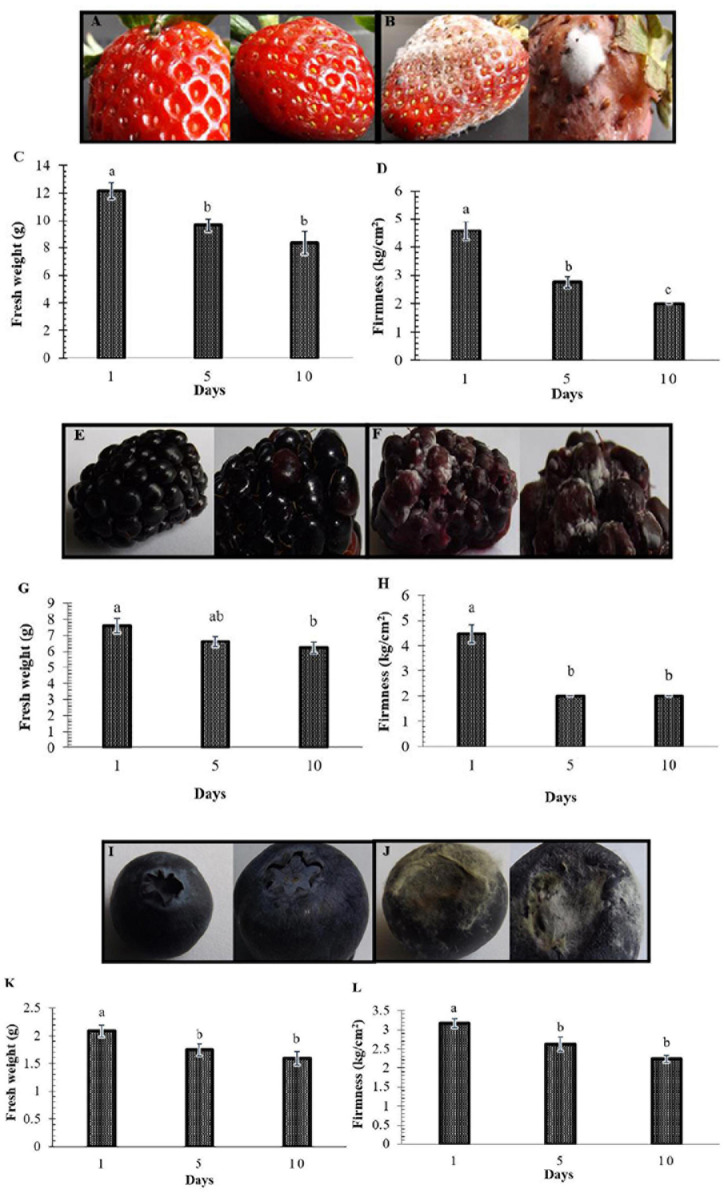
FIGURE 1.
Postharvest decay in berries represented by loss of weight and firmness. Representative fruit are shown in Panels (A,B,E,F,I,J). (A,E,I) Fruit at the beginning of the study (control). (B,F,J) Fruit in decay on days 5 and 10. Panels (C,G,K) show the decrease in the weight of strawberries, blackberries, and blueberries, respectively. Panels (D,H,L) show the decline in firmness. Bars represent means ± standard deviation (n = 12). The letters indicate that the means differ significantly according to Duncan’s multiple range test (p < 0.05).

