Fig. 1.

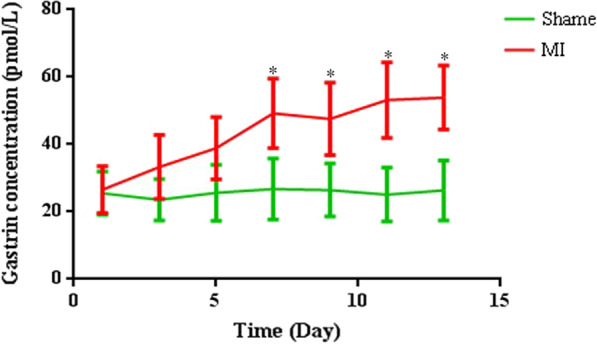
Comparison of plasma concentrations of gastrin at different days (day 1, 3, 5, 7, 11, and 13) in the myocardial infarction (MI) mice and in sham-operated mice. Data are expressed as the mean ± SD. n = 8. *P < 0.05, vs. sham-operated mice

Comparison of plasma concentrations of gastrin at different days (day 1, 3, 5, 7, 11, and 13) in the myocardial infarction (MI) mice and in sham-operated mice. Data are expressed as the mean ± SD. n = 8. *P < 0.05, vs. sham-operated mice