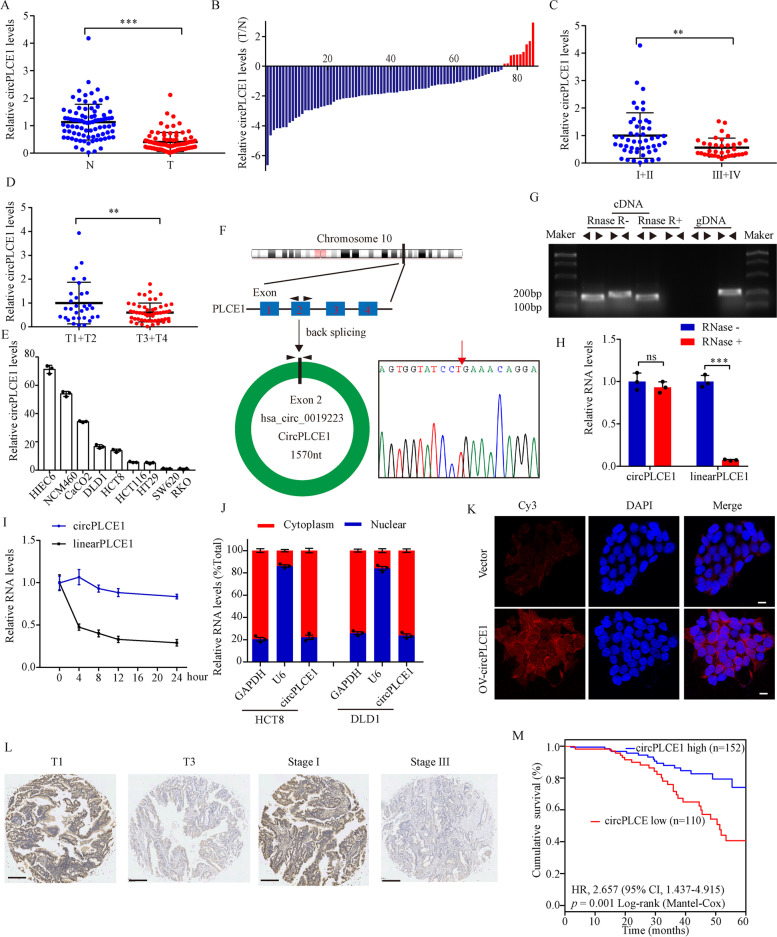
Fig. 1.
Characterization and clinical signification of circPLCE1. A qRT-PCR analysis of circPLCE1 expression in 85 paired CRC samples and normal adjacent tissues. B Fold change of circPLCE1 expression in 85 paired CRC tissues. C Comparison of circPLCE1 expression between patients with clinical stage III–IV (n = 35) and those with clinical stage I–II (n = 50), detected by qRT-PCR. D Comparison of circPLCE1 expression between patients with T stage 3–4 (n = 53) and those with T stage 1–2 (n = 32), detected by qRT-PCR. E qRT-PCR analysis of circPLCE1 expression in normal human intestinal epithelial and CRC cell lines, n = 3. F Genomic loci of the PLCE1 gene and circPLCE1. Red arrow indicates the back-splicing of PLCE1 exon 2 confirmed by Sanger sequencing. G RT-PCR analysis of the existence of circPLCE1 with the divergent primers and convergent primers in complementary DNA (cDNA) and genomic DNA (gDNA). H qRT-PCR analysis of circPLCE1 and PLCE1 linear mRNA treated with or without RNase R, n = 3. I qRT-PCR analysis of the abundance of circPLCE1 and PLCE1 linear mRNA in HCT8 cells treated with actinomycin D at the indicated time points, n = 3. J qRT-PCR analysis of circPLCE1 location in the nucleus or cytoplasm in HCT8 cells. GADPH served as a marker of cytoplasmic location, whileU6 served as a marker of nuclear location, n = 3. K Representative images for FISH circPLCE1 staining in HCT8 cells. Scale bar = 10 μm. L Representative images of ISH circPLCE1 expression in the paraffin-embedded CRC tissues of T stage T1 and T3 and clinical stage I and III. Scale bar = 250 μm. M Kaplan–Meier curves for survival of CRC patients with low vs. high expression of circPLCE1. N, normal adjacent tissues tissues; T, tumor tissues. Values are represented as mean ± SD. **p < 0.01, ***p < 0.001, ns (no significance), by 2-tailed Student’s t test

