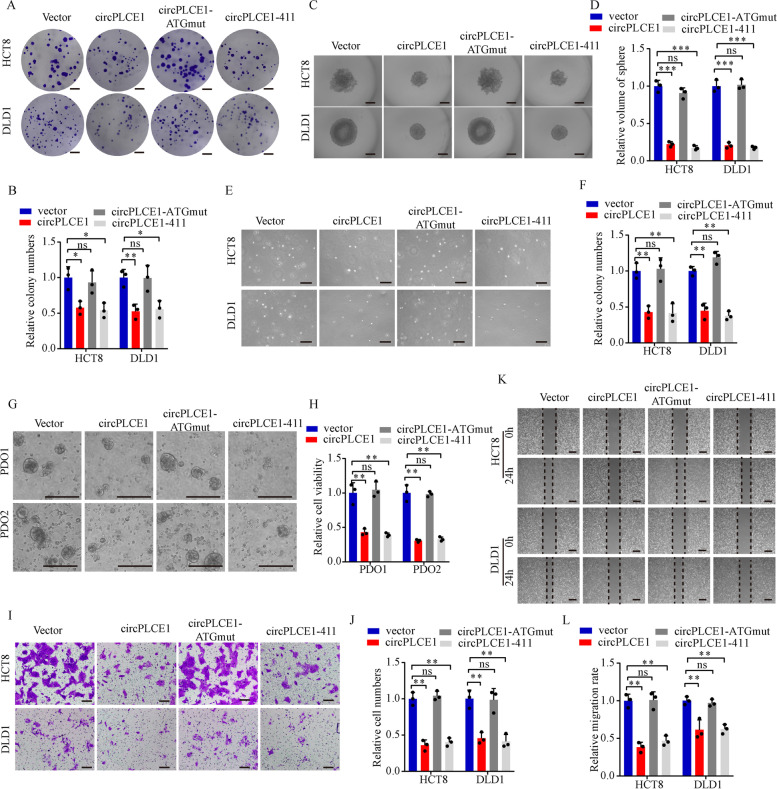
Fig. 4.
circPLCE1-411, not circPLCE1 itself, inhibits CRC cell progression. A and B Colony formation assays of HCT8 and DLD1 cells transfected with empty vector, circPLCE1 vector, circPLCE1-ATGmut vector and circPLCE1-411 vector, n = 3. C and D Sphere formation assays of HCT8 and DLD1 cells transfected with empty vector, circPLCE1 vector, circPLCE1-ATGmut vector and circPLCE1-411 vector, n = 3. Scale bar = 500 μm. E and F Anchorage-independent growth of HCT8 and DLD1 cells transfected with empty vector, circPLCE1 vector, circPLCE1-ATGmut vector and circPLCE1-411 vector, n = 3. Scale bar = 200 μm. G and H Patient-derived organoids (PDOs) growth with empty vector, circPLCE1 vector, circPLCE1-ATGmut vector and circPLCE1-411 vector transfection, n = 3. Scale bar = 200 μm. I and J migration assays of HCT8 and DLD1 cells transfected with empty vector, circPLCE1 vector, circPLCE1-ATGmut vector and circPLCE1-411 vector, n = 3. Scale bar = 100 μm. K and L wound-healing assays of HCT8 and DLD1 cells transfected with empty vector, circPLCE1 vector, circPLCE1-ATGmut vector and circPLCE1-411 vector, n = 3. Scale bar = 100 μm. Values are represented as mean ± SD. *p < 0.05, **p < 0.01, ***p < 0.001, ns (no significance), by one-way ANOVA

