
FIGURE 2.
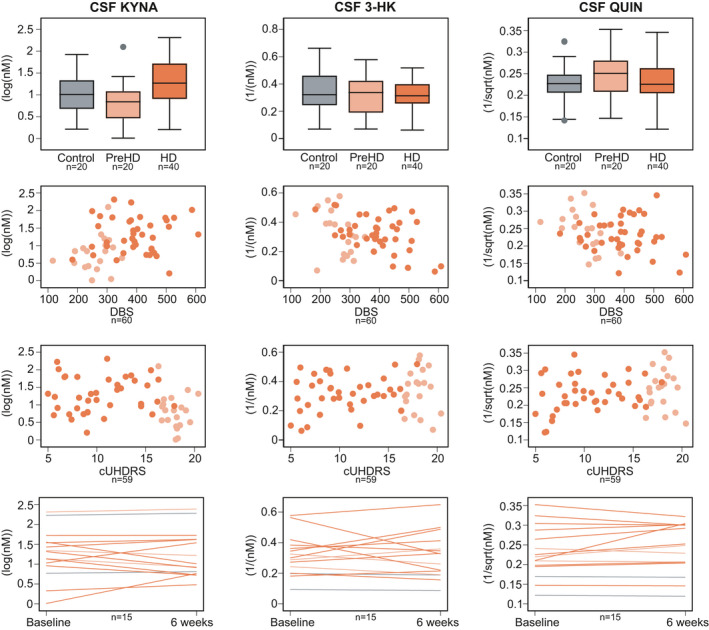
Intergroup differences (top row), associations with Disease Burden Score (DBS, second row) and composite Unified Huntington's Disease Rating Scale (cUHDRS, third row), and within‐subject short‐term stability (bottom row) for primary outcomes: cerebrospinal fluid (CSF) kynurenic acid (KYNA), CSF 3‐hydroxykynurenine (3‐HK) and CSF quinolinic acid (QUIN). Associations were not found in any of the analyses. See Tables 2, S2 and S3 for point estimates and 95% CI. Grey represents healthy controls, light orange preHD and dark orange HD