FIGURE 5.

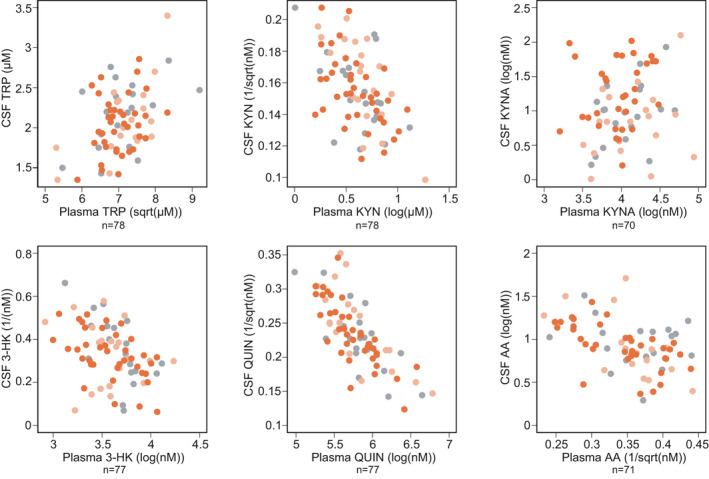
Associations between CSF and plasma. See Table S4 for point estimates and 95% CI. Grey represents healthy controls, light orange preHD and dark orange HD

Associations between CSF and plasma. See Table S4 for point estimates and 95% CI. Grey represents healthy controls, light orange preHD and dark orange HD