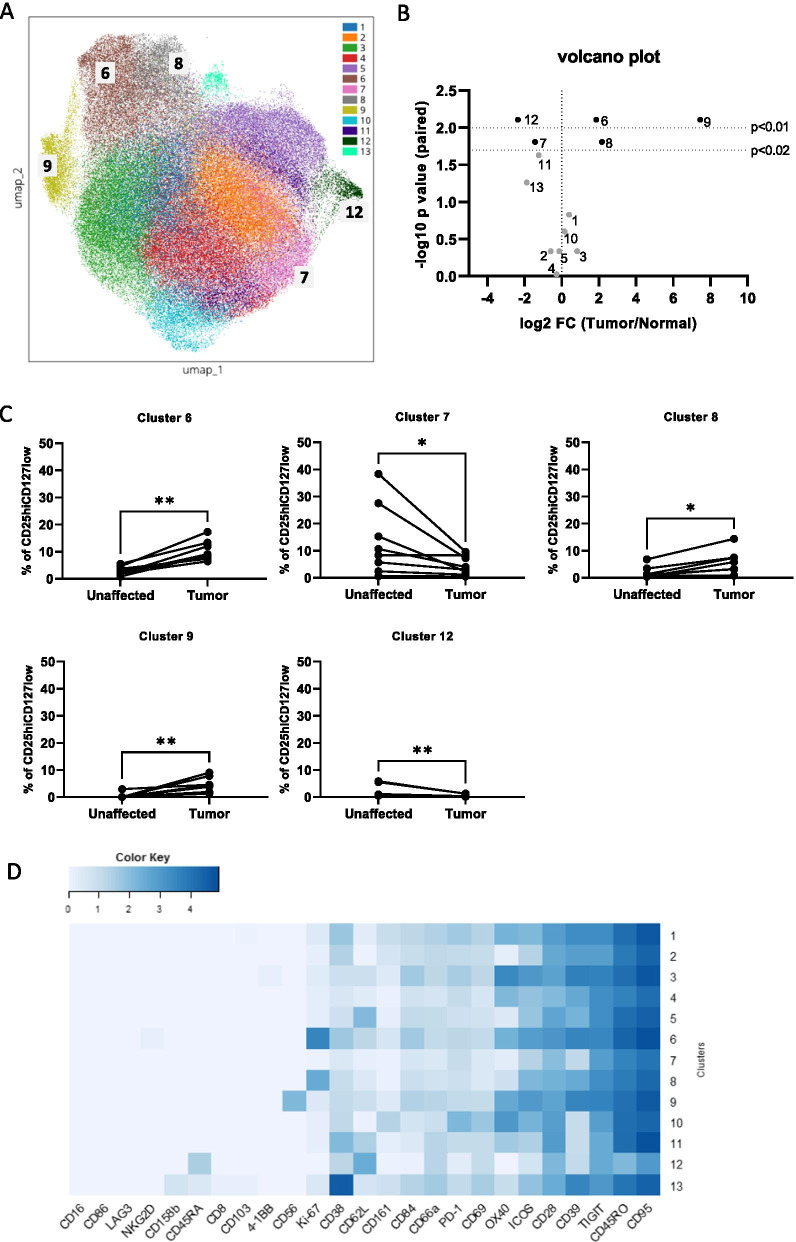
Fig. 1.
Unsupervised clustering of Treg from colon tissues. Single CD45+ cell suspensions from unaffected colon tissue and tumors were analysed by mass cytometry. A Phenograph clustering of Treg resulted in 13 metaclusters which are overlayed on the corresponding UMAP plot. B Volcano plot shows the fold change of the median cluster frequencies plotted against the p value of the paired analysis between unaffected and tumor tissue. C Frequencies of cells designated to the significantly increased or decreased clusters in unaffected and tumor tissue. Symbols represent individual values and values from the same patient are connected. D Heatmap showing the median signal intensities of the respective markers in the different clusters. Color coding is applied over the whole heatmap. *p < 0.02, **p < 0.01, n = 8

