Fig. 4.
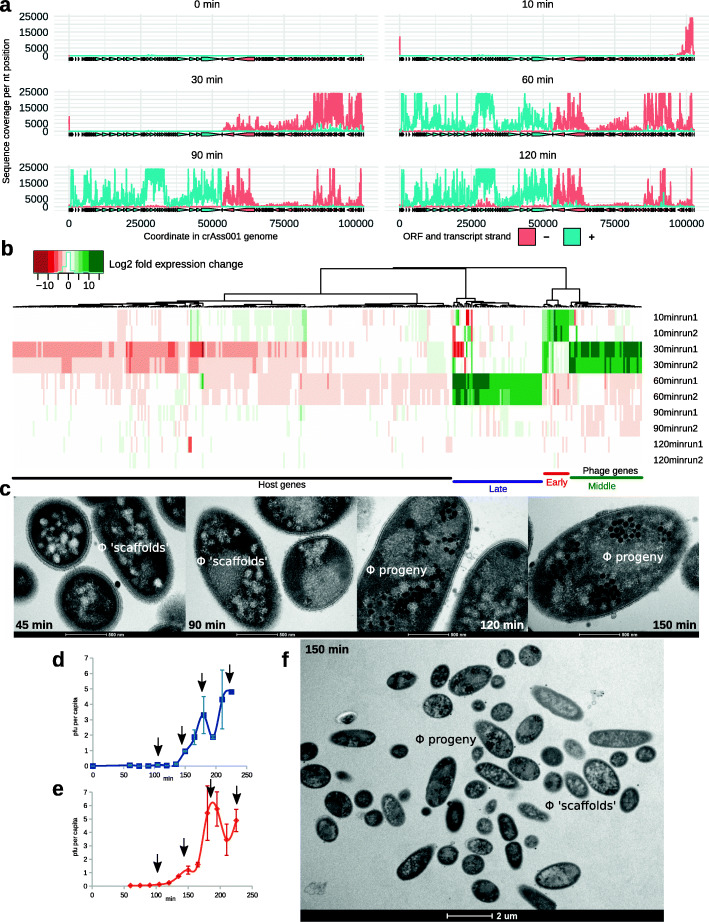
Transcriptional and morphological presentation of ΦcrAss001 infection in a one-step growth experiment. a Transcription of phage genome 0–120 min after infection revealed using stranded RNAseq; positive and negative strand ORFs and RNAseq coverage levels are shown in blue and red, respectively; plots are representative of two independent experiments; b time course of transcriptional responses of host and phage genomes (values are log2 fold gene transcript expression change relative to the previous time point from two independent experimental runs); only genes with significantly different expression of sense DNA strand between any of the successive time points (p < 0.05 in DESeq2, n = 372) are shown; c time-course of morphological changes in B. intestinalis cells infected with ΦcrAss001, ultrathin section TEM (x43,000); notable are intracellular phage progeny and possible “phage scaffolds” in the early stages of virion assembly; d, e enumeration of per capita phage progeny produced in a one-step growth experiment by B. intestinalis cells infected with ΦcrAss001 [MOI=1 in panel (d), MOI=10 in panel (e)], arrows indicate likely timing of lysis events, including the two “invisible” ones at ~110 and 150 min; f intact cells after first phage burst (150 min), still showing hallmark features of the early and middle infection stages (x6000)

