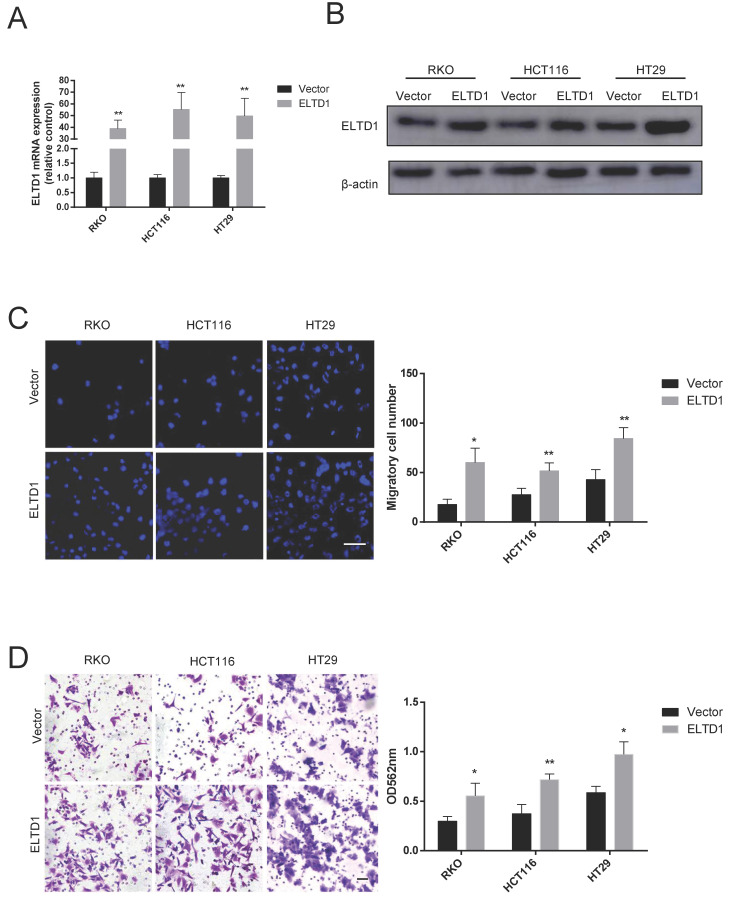
Figure 4.
Overexpression of ELTD1 promoted CRC cell migration and invasion. (A, B) The mRNA and protein expression levels of ELTD1 were measured by qRT-PCR and Western blotting, respectively after transfection with the pEnCMV-ELTD1-3xFLAG plasmid. β-actin was used as the internal control. (C) Representative DAPI staining and statistical results of CRC cells in the Transwell assay. (D) Representative crystal violet staining and statistical results of CRC cells in the invasion assay. The results are shown as the mean ± standard deviation (SD) of three independent experiments. **p<0.01 and *p<0.05. Scale bar=100 μm.

