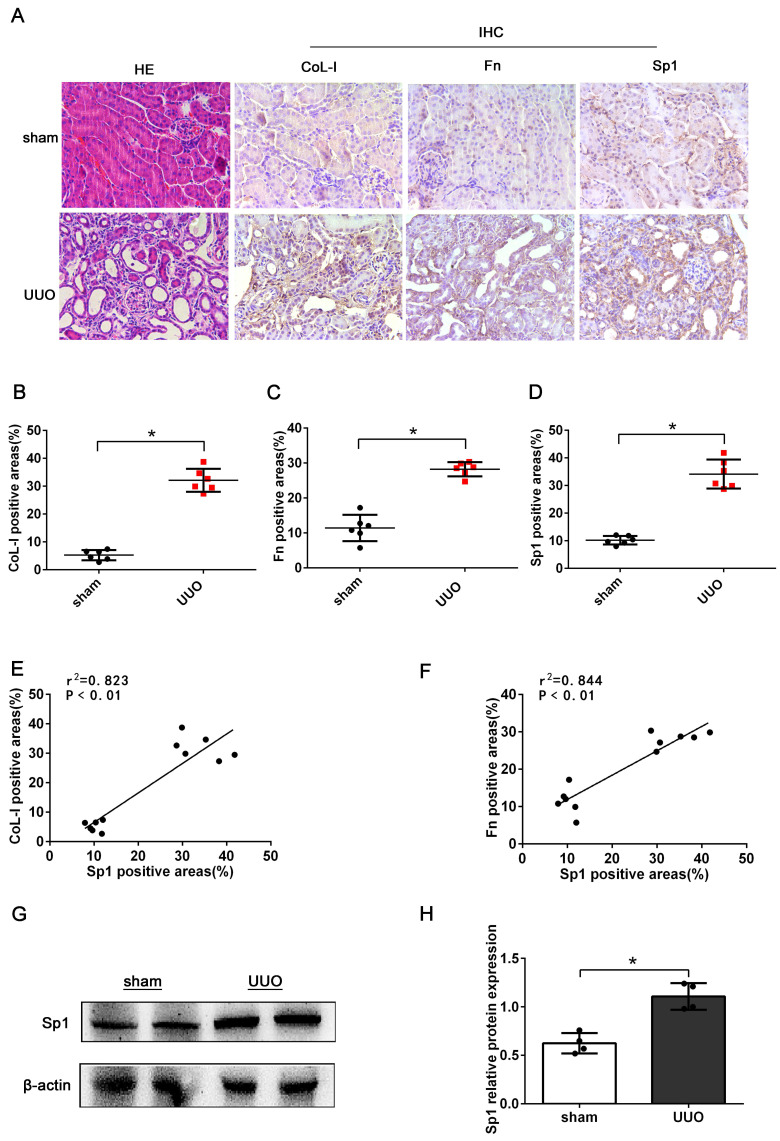
Figure 1.
The expression levels of Sp1 in UUO kidneys. (A) HE staining of the kidneys of UUO mice and the IHC analysis of CoL-1, Fn, and Sp1 in renal tissues (400×). (B-D) Areas showing positive immunostaining for CoL-1, Fn, and Sp1 in mice kidneys. Data are presented as mean ±SEM (n=6). (E-F) Correlation analysis of CoL-I and Fn expression levels with Sp1, as determined by the IHC analysis of mice kidneys (n=6). (G-H) Western blotting and densitometric analyses of Sp1 expression in the kidneys of UUO mice; *P<0.05, data are presented as the mean ±SEM (n=4).

