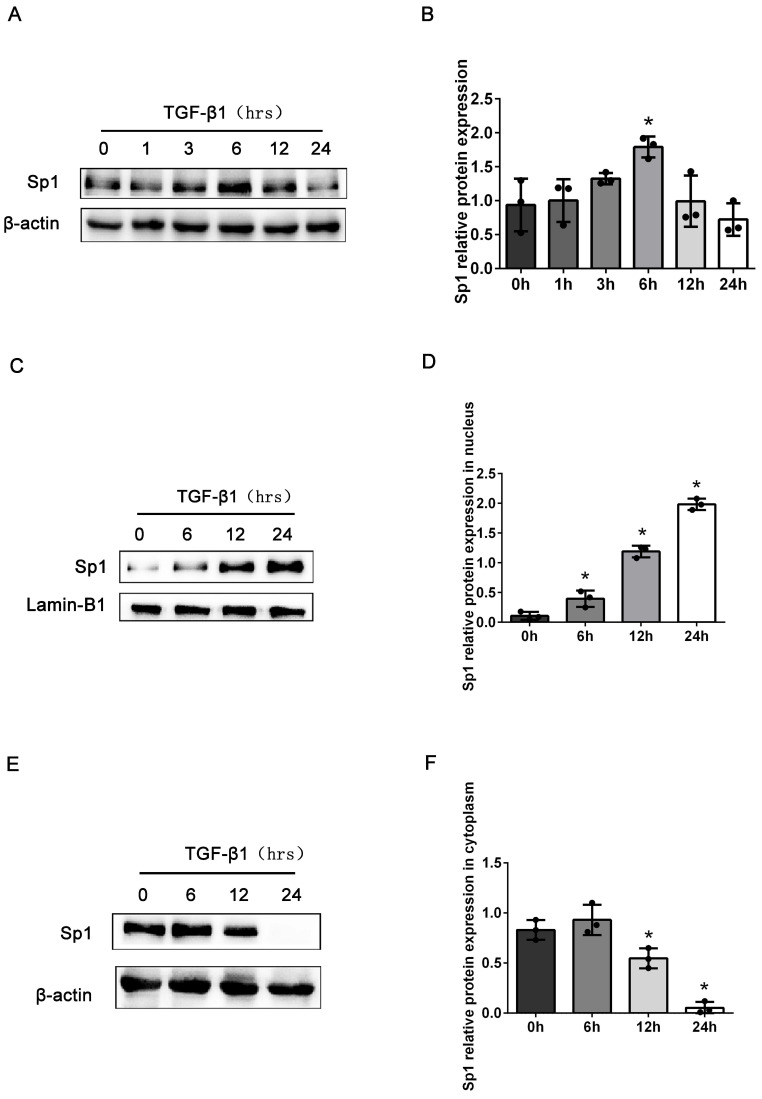
Figure 2.
The expression levels of Sp1 in BUMPT cells exposed to TGF-β1. (A-B) Western blotting and densitometric analyses of Sp1 expression in whole BUMPT cells after stimulation with TGF-β1(5 ng/ml). (C-D) Western blotting and densitometric analyses of Sp1 expression in the nuclei of BUMPT cells after TGF-β1 stimulation. (E-F) Western blotting and densitometric analyses of Sp1 expression in the cytoplasm of BUMPT cells after TGF-β1 stimulation. *P<0.05, #P<0.05, &P<0.05; data are presented as the mean ±SEM (n=3).

