Figure 4.
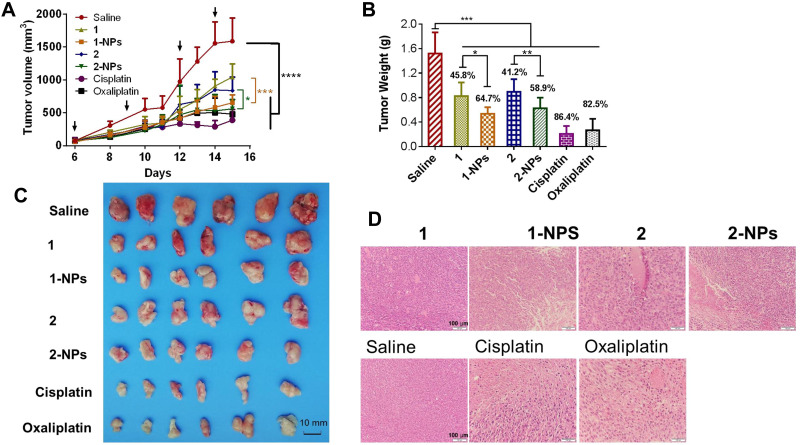
In vivo antitumor activities of nanoparticles and free naproxen platinum(IV) compounds to CT-26 homograft tumors in BALB/c mice. Dosage: 4 μg Pt/kg for 1-NPs (i.v.), 1 (i.p.) and oxaliplatin (i.v.); 2 μg Pt/kg for 2-NPs (i.v.), 2 (i.p.) and cisplatin (i.v.). Drugs were injected on days 6, 9, 12, 14 posttumor inoculation as indicated by the arrows in Figure 4A. (A) Tumor growth as a function of time. (B) Tumor weight in each group at the end of the experiment. The TGI of the tested drugs are depicted above the column (TGI=tumor weight of drug treated group/tumor weight of saline group). (C) The images of the tumors at the end of the experiment. (D) The H&E staining of slices from tumor tissues.
Notes: Results are presented as the mean ± SD (n=6). *P<0.05, *P<0.05, ***P<0.001, ****P<0.001.
Abbreviations: NPs, nanoparticles; i.p., intraperitoneal; i.v., intravenous; TGI, growth inhibition rate; H&E, hematoxylin and eosin.

