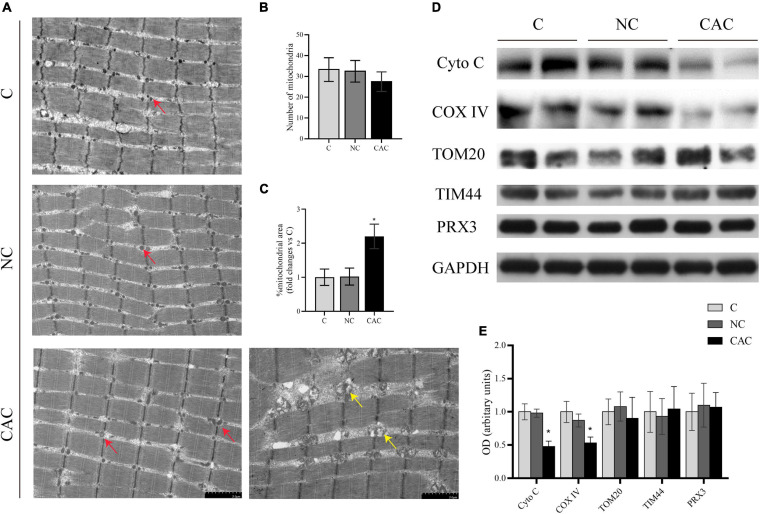
FIGURE 2.
(A) Typical images under a transmission electron microscope. Red arrow indicates the normal mitochondrion, yellow arrow indicates the swollen and abnormal mitochondrion. (B) Quantification of mitochondrial number from the area of 96.9 μm2 (n = 3). (C) Quantification of mitochondrial area. (D) Levels of Cyto C, COX IV, TOM20, TIM44, and PRX3 by Western blot. (E) Quantification of (D) C, control, patients with benign disease; NC, patients of non-cachexia; CAC, cancer patients with cachexia. *p < 0.05. Data are displayed as mean ± standard deviation.

