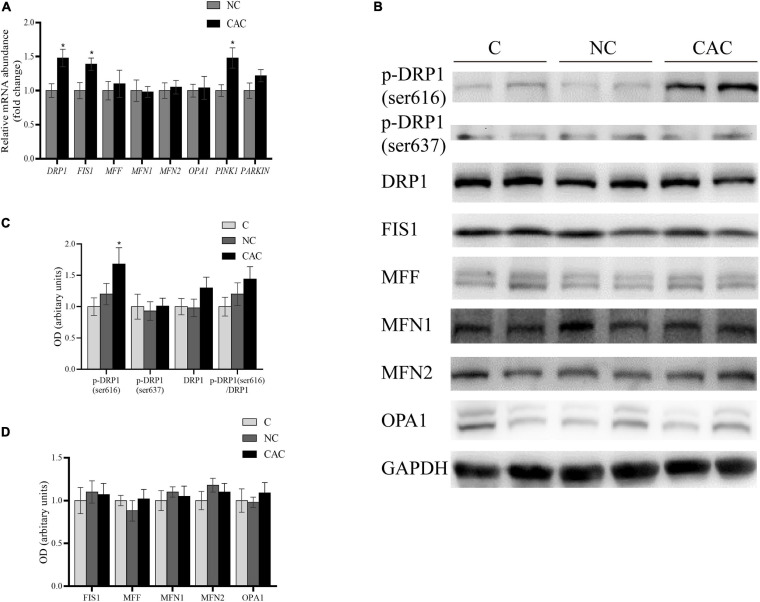
FIGURE 3.
(A) Quantification of relative gene expressions of DRP1, FIS1, MFF, MFN1, MFN2, OPA1, PINK1, and PARKIN by real-time PCR. (B) Levels of DRP1, p-DRP1(ser616), p-DRP1(ser637), FIS1, MFF, MFN1, MFN2, OPA1, and GAPDH by Western blot. (C) Quantification of DRP1, p-DRP1(ser616), p-DRP1(ser637), and DRP1/p-DRP1 ratio. (D) Quantification of FIS1, MFF, MFN1, MFN2, and OPA1. C, control, patients with benign disease; NC, patients of non-cachexia; CAC, cancer patients with cachexia. *p < 0.05. Data are displayed as mean ± standard deviation.

