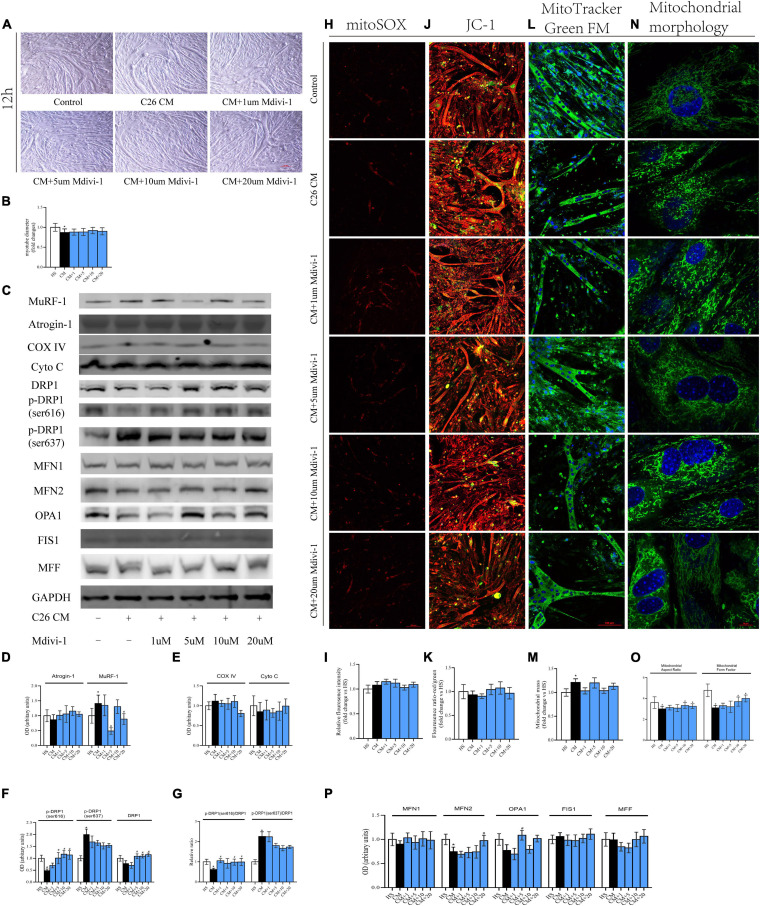
FIGURE 4.
(A) Typical images of the C2C12 myotube cocultured with CM for 12 h. (B) Quantification of myotube diameter. (C) Levels of Atrogin-1, MuRF-1, DRP1, p-DRP1(ser616), p-DRP1(ser637), Cyto C, COX IV, and GAPDH by Western blot. (D) Quantification of Atrogin-1 and MuRF-1. (E) Quantification of Cyto C and COX IV. (F) Quantification of DRP1, p-DRP1(ser616), and p-DRP1(ser637). (G) Quantification of p-DRP1(ser616)/DRP1 and p-DRP1(ser637)/DRP1 ratio. (H) Typical images to analyze mitoROS by mitoSOX. (I) Quantification of mitoSOX with fluorescence ratio (Ex/Em = 510/580 nm). (J) Typical images to analyze MMP by JC-1. (K) Quantification of MMP with fluorescence intensity (red/green) ratio by ImageJ software. (L) Typical images to analyze mitochondrial mass by Mito-Tracker Green FM. (M) Quantification of mitochondrial mass with fluorescence intensity by ImageJ software. (N) Typical images to analyze mitochondrial morphology in myoblasts by MitoTracker Green FM. (O) Quantification of mitochondrial morphology by Mitochondrion Analyzer, a plugin of ImageJ software. FF (form factor: the reciprocal of circularity value) and AR (aspect ratio: major axis/minor axis of an ellipse equivalent to the object). (P) Quantification of MFN1, MFN2, OPA1, FIS1, and MFF; control: myotube cultured in DMEM of 2% HS; CM (conditional medium): myotube cultured in DMEM of 33% C26 conditional medium; *p < 0.05 vs. control group; #p < 0.05 vs. CM group. Data are displayed as mean ± standard deviation.

